How To Value Network-Based Digital Assets (ETH & BTC)
Understanding the cyclical and secular trends of technological adoption
February 09, 2023
GM DOers!
To be a winner in business, tech, or investing it’s important to understand trends.
While we usually uncover the trends of business models and new primitives in the space at Milk Road, it’s also important to understand the trends of technological adoption and how it’s valued.
Why? 🤔
Because if you understand the macro trends of blockchain adoption and markets you can properly position your business and finances for the future.
It allows you to proactively hire or fire staff, search for investment at the most opportune times, and prepare your personal and business capital based on where markets are heading.
Without understanding and staying ahead of the trends, you are forced to react, which usually means leaving money and opportunity on the table. 😬
In today's report, I’m going to share the two main trends that drive adoption and, subsequently, the price of a technology. This will allow you to zoom out as a founder or investor and help you make more informed decisions.
And no, this has nothing to do with technical analysis, trading, or specific tokens to invest in. I can’t time the top or bottom or pick the next 100x, nor do I care to.
What I can do however is explain the cyclical nature of technology and crypto and its driving force—and no it’s not the bitcoin halving cycle as this happens in non-crypto prices too. 🤷♀️
I’ll also explain the long-term secular trend of technological adoption, allowing you to position yourself for the long term and make medium-term financial and operational decisions.
Today we aren’t going on-chain…
Instead, we’re pulling out our charts. By the way, if you currently look at Bitcoin, Ethereum, or technology stocks on a chart like the one below, then you’re doing it wrong and this report is for you.
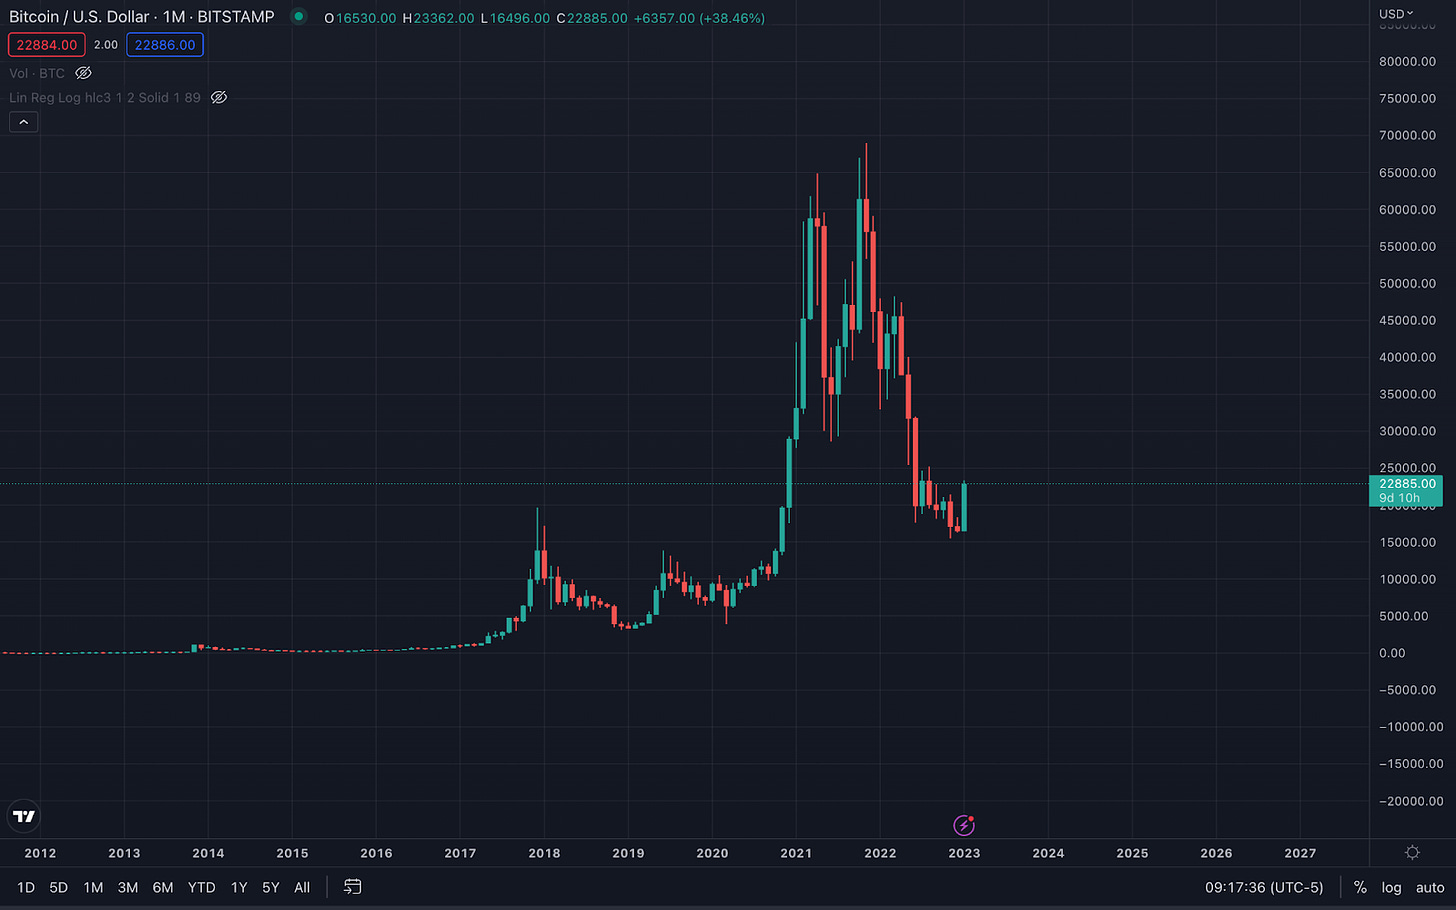
Prepare to be in the <1% that truly understands what’s happening in this industry.
Secular Versus Cyclical Trends
First, let’s understand the difference between secular and cyclical trends.
Secular trends are trends that occur over a long time period (years to decades). In the investing world, they use the term “secular bull run” to describe long-term price increases. 📈
US equities for example have been in a secular bull run for decades. Notice the “number go up” trend in the chart below of the S&P 500 (the top 500 US Equities at the time) since the 1940s.
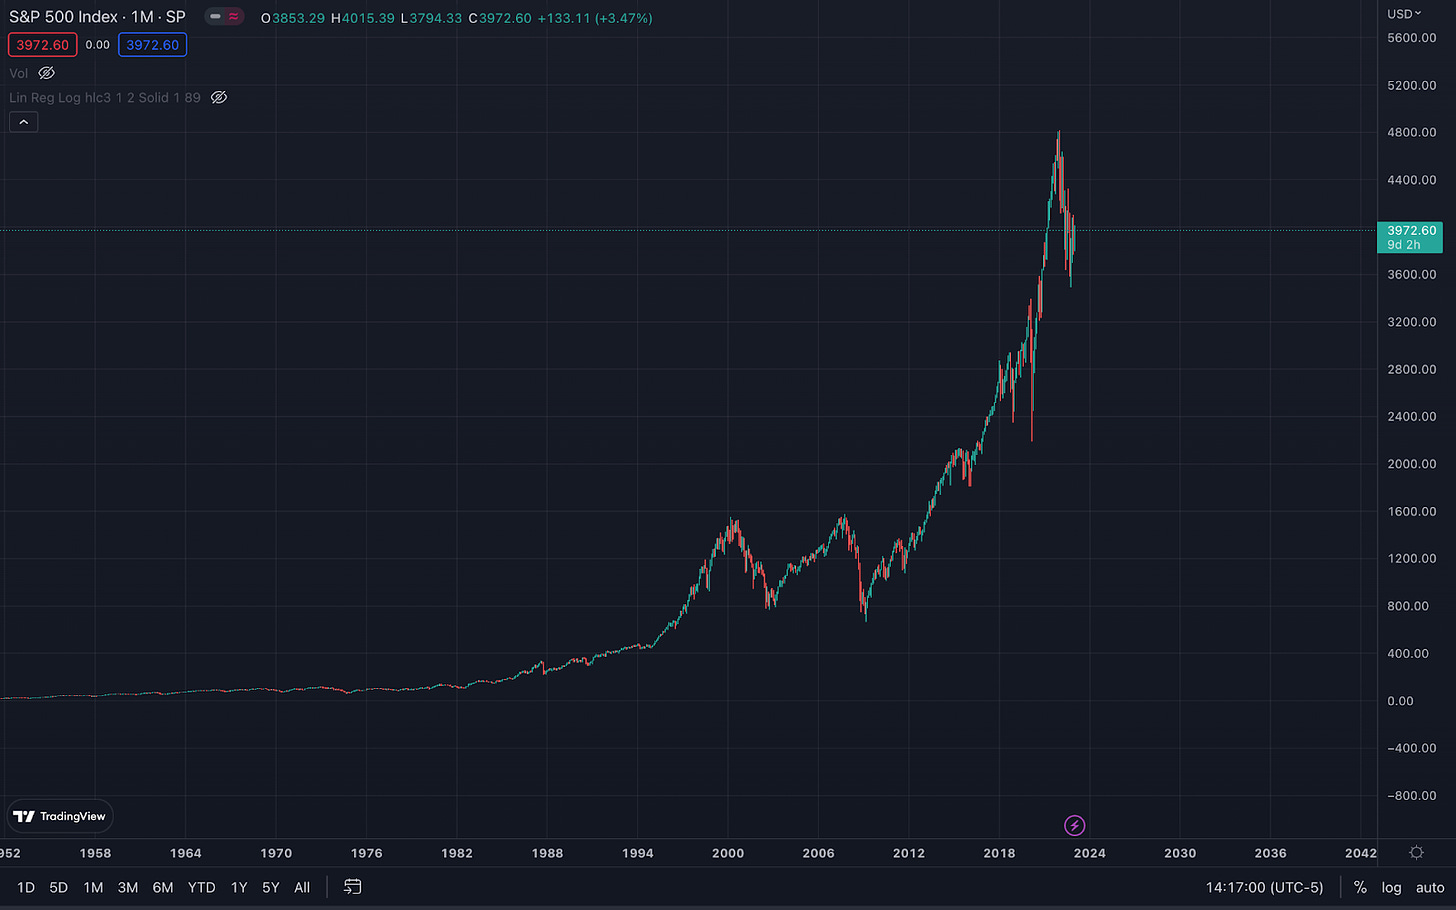
Of course, the price of US equities has gone up and down plenty over individual years. But in a secular trend, you tend to ignore these blips and instead consider price action over many years to decades.
In technological adoption, you can think of the internet as being in a secular trend since the 90s. The adoption rate goes up and down, but ultimately, it has been nothing but “number go up” over time. ❌
Cyclical trends on the other hand are more short-term and sit within a secular trend. You can think of these as seasonal or following the booms and busts of the business cycle.
More on this later. Right now, let’s dive deeper into understanding the secular trends of technology.
Secular Adoption Trends of Technology
Amazon and Apple, for example, have both been in a secular trend of technological adoption since the 90s. These trends can be attributed to the network effect of their technologies and explained via Metcalfe's Law.
Metcalfe's law states that the value of a network is proportional to the square of the number of connected users in the system.
(Stay with me here… this will all make sense in a few seconds)
In layman's terms, what this means is that for each new person added to a network, the network becomes more valuable.
Each new person added to a network creates a positive feedback loop for more members to be added to the network while also strengthening the connections of the existing members. 💪

If you think about the internet, it became better as more users were onboarded, more websites were created, more businesses started using it and more technologies tapped into it.
Amazon became better as more items were listed on the marketplace and as more items were listed on the marketplace more buyers started using the marketplace, creating a positive flywheel of adoption.
The iPhone became more valuable as more people had iPhones and you could message more people in blue rather than green. 😉
I’m kidding (sort of), but ultimately the App Store became more valuable as more apps were built on it and more users started using those apps.
Amazon and Apple are both technologies that have benefited from Metcalfe’s law and achieved sustained network effects and thus, exponential adoption.
Technologies that achieve exponential adoption in terms of users also typically translate into achieving exponential growth in terms of valuation. 🤝
To be clear, exponential simply means numbers that increase or decrease more and more rapidly over time. As the adoption of these technologies picks up, it becomes faster and faster due to Metcalfe’s Law.
Of course, this does end at some point. But that’s how it begins and grows for a certain period of time during its secular trend.
This brings me to the first key lesson of this report:
Logarithmic Charts > Linear Charts
When valuing technologies with exponential adoption, we must view their values in exponential scales, rather than linear scales.
This means that when you look at a price chart of network-based companies or technologies, it’s better to look at them on a logarithmic scale (1, 2, 4, 8, 16, 32, 64, 128...) rather than the typical linear scale (1, 2, 3, 4, 5, 6, 7, 8…)
Why?
Because the cyclical trends within a technology that enjoys significant network effects are exaggerated and it can alter your perspective on the overall trend of a technology.
These technologies often look like they are in a bubble, resulting in many analysts and investors missing the incredible upside of Amazon’s secular bull run over the last 25 years. 💁♂️
Here is a chart of Amazon on a linear scale since 1997. Did the bubble just pop?
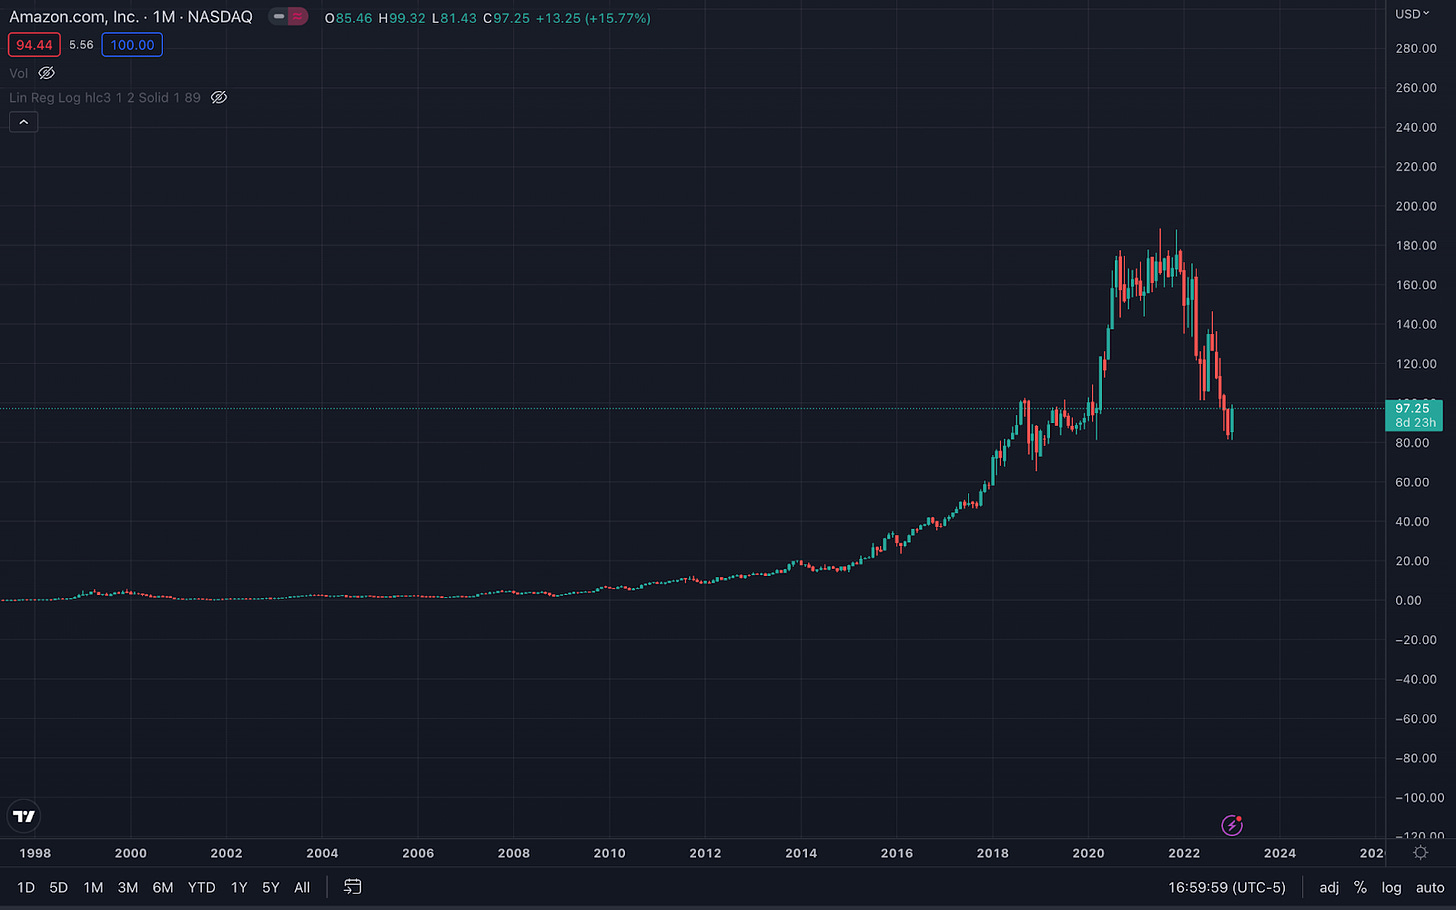
Here is a chart of Amazon on a logarithmic scale since 1997. This “bubble” now looks irrelevant.
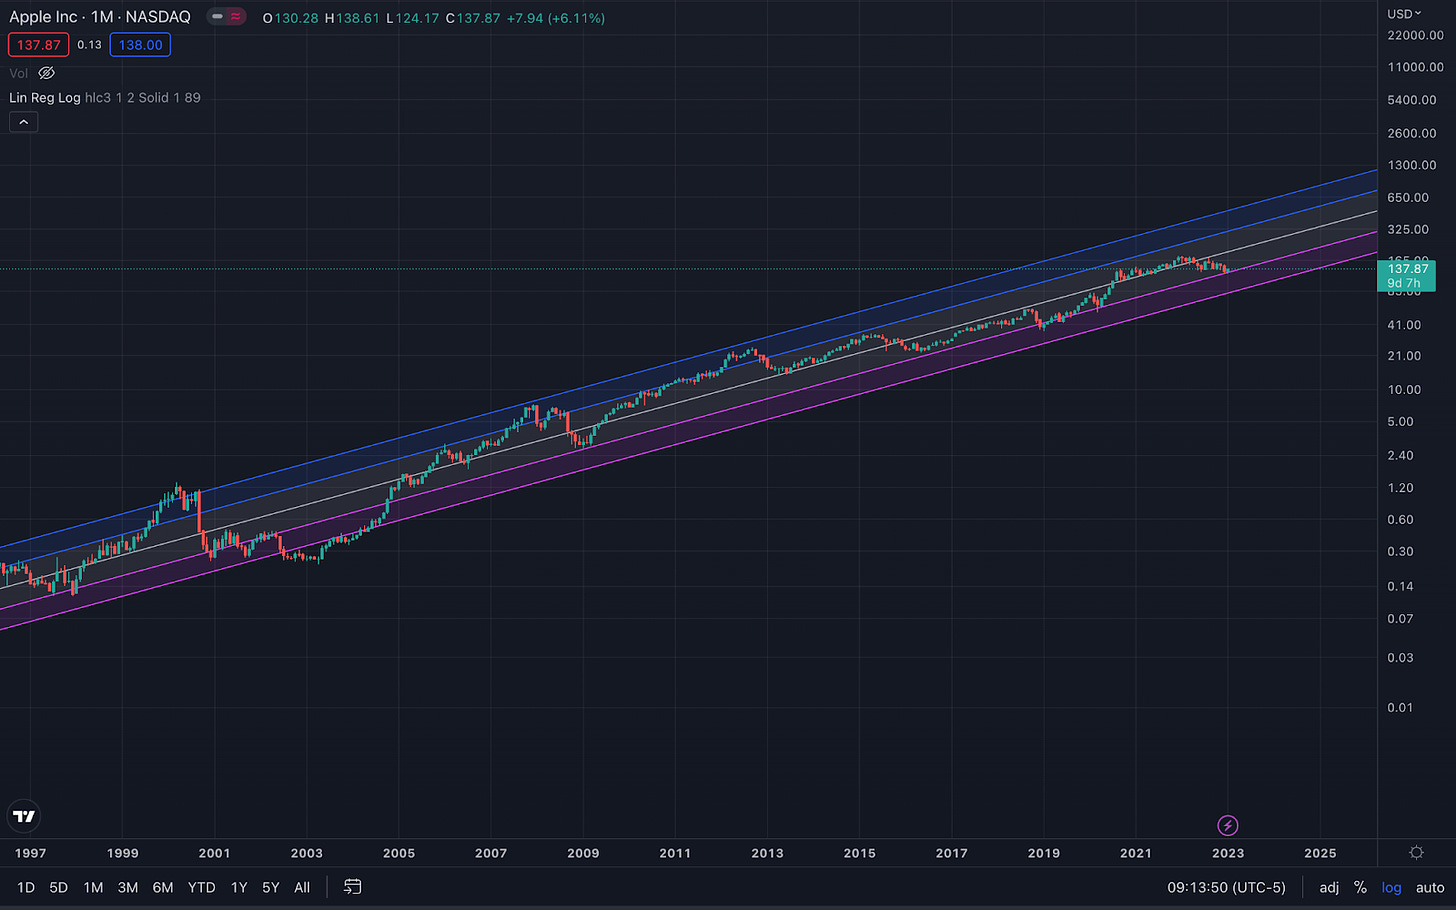
The purple, blue, and grey lines are a simple logarithmic regression channel, which is essentially mapping exponential adoption or exponential growth in price based on standard deviations of price.
Note: Each line (other than the middle one) represents a 1 standard deviation excursion from the mean.

Now, below is the same chart of Amazon on a logarithmic scale but each “bubble” like we saw in the linear chart is noted. Amazon was in a “bubble” 6 times and dropped 30% or more.
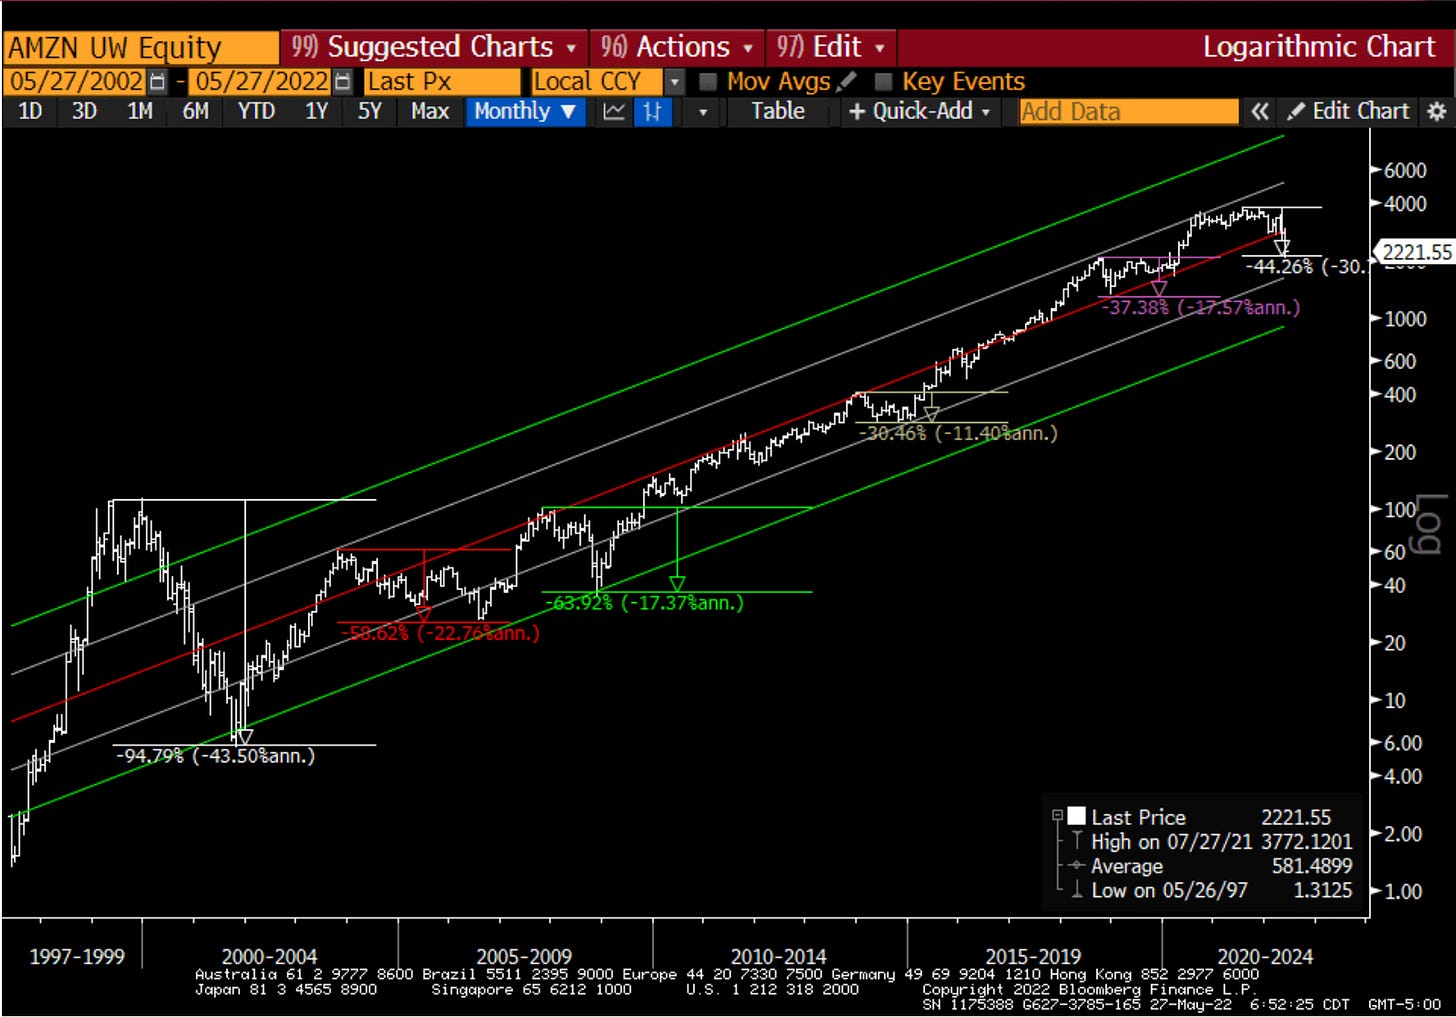
Each time we move 1 or 2 standard deviations below or above the exponential trend line we find our way back, so long as the network isn’t broken.
This can only be seen in a logarithmic chart because Amazon’s growth is exponential, not linear.
Technologies with network effects all grow in a similar pattern, albeit at varying speeds depending on the amount of “participant types” (think end users, application builders, etc.) in the network creating connections.
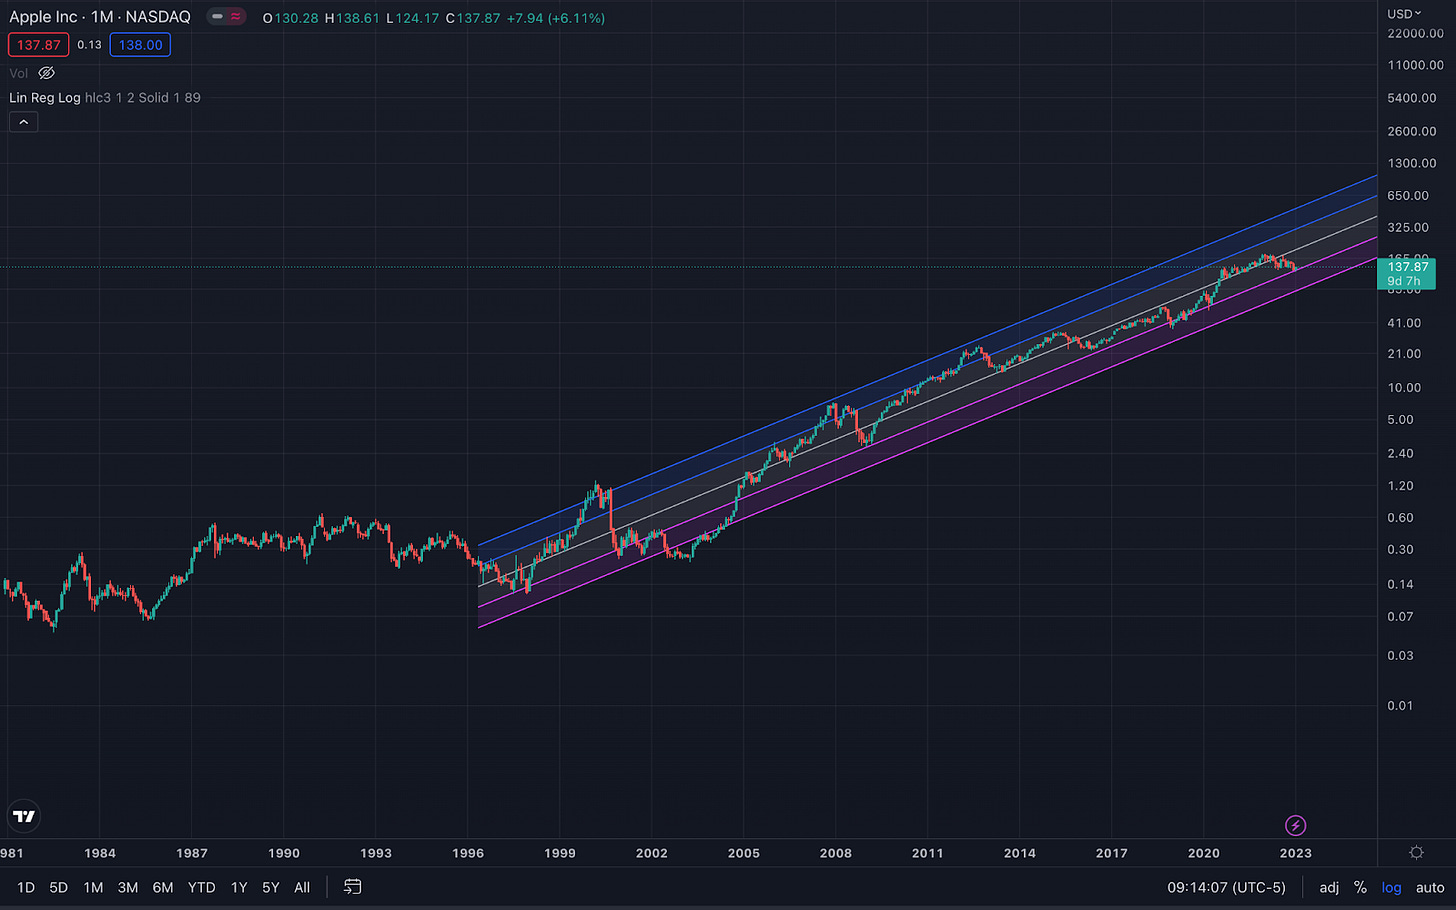
Here’s a logarithmic chart of Apple since 1997.
And here is Google (aka Alphabet Inc.).

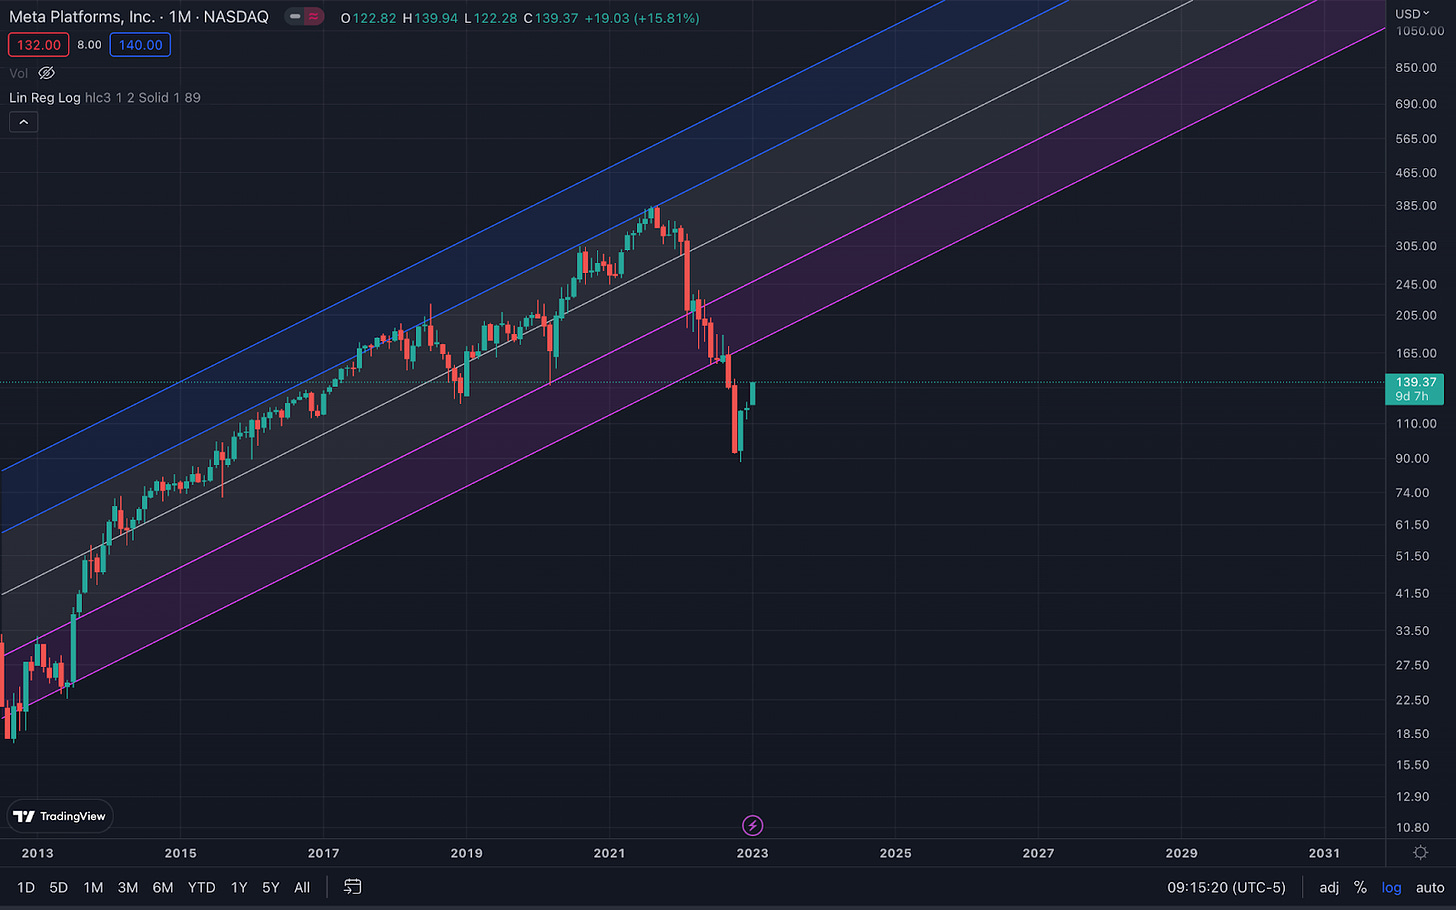
The cyclical trends can move the values above or below the trend line, however along the secular trend it typically remains within the channel of 2 standard deviations from the trend line (ie. the dark blue and purple lines at the edges).
If a network breaks, it can fall out of the channel and potentially head to 0 (ie. MySpace). Though, it can break the channel and come back too.
Here is a chart of Meta currently, which is in a critical moment in terms of the network effects of their technologies.
The adoption of Meta apps has slowed significantly and investors are betting that the network effects are broken (for now).
I showed you a chart of Bitcoin on a linear scale at the top of this report, it looks ridiculous.
Here’s what happens when you put it on a logarithmic scale.
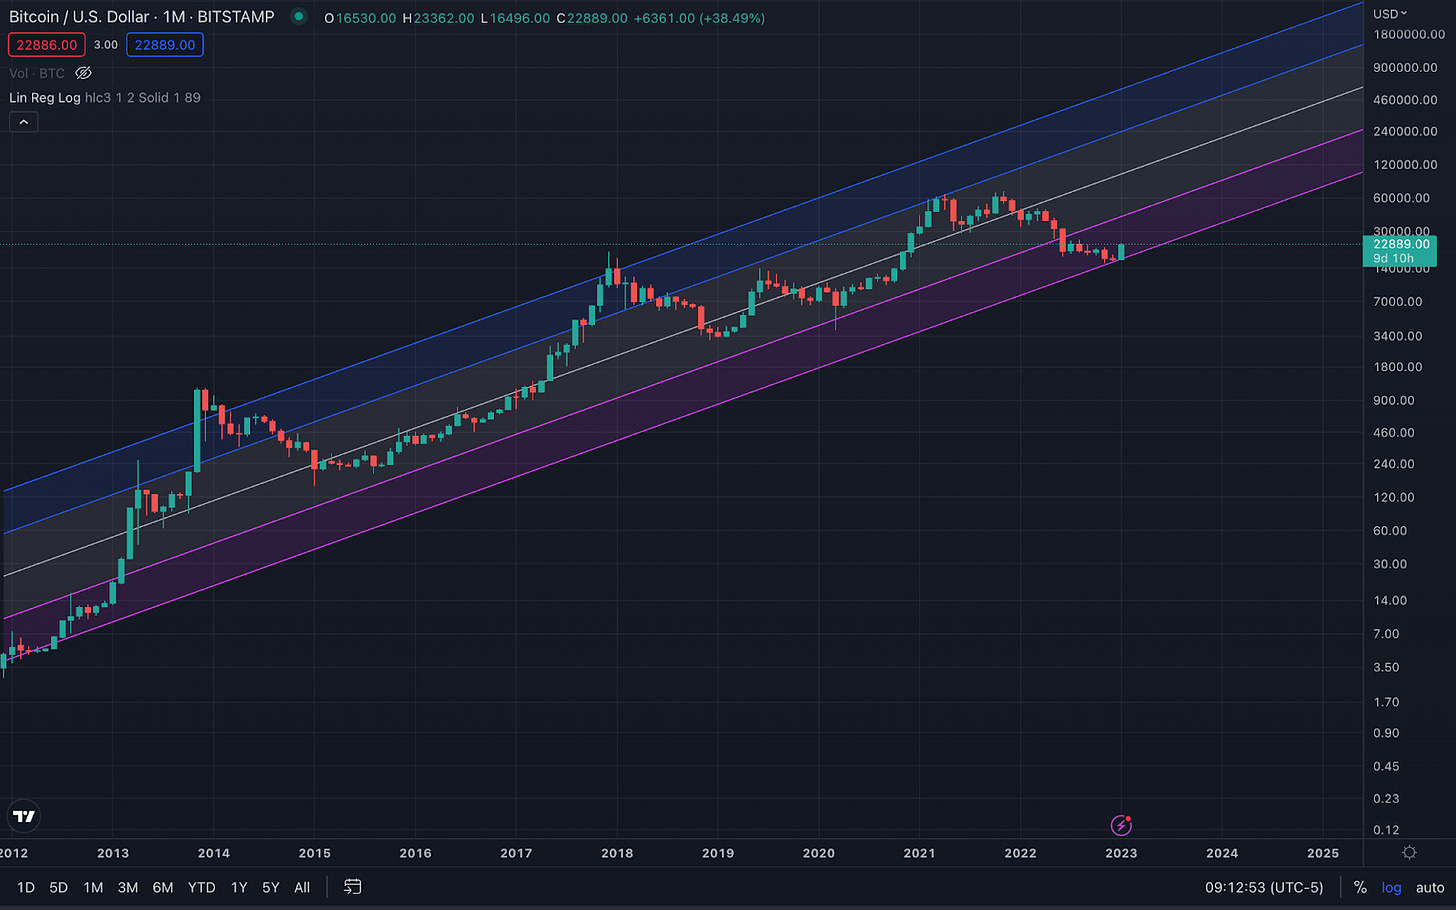
It fits perfectly in the channel since achieving meaningful adoption in its first cyclical cycle in 2012. Interesting to see it rip off the bottom of the channel here in January too. 👀
And finally, here is Ethereum. It’s still early days for the technology but it’s already found its exponential adoption.
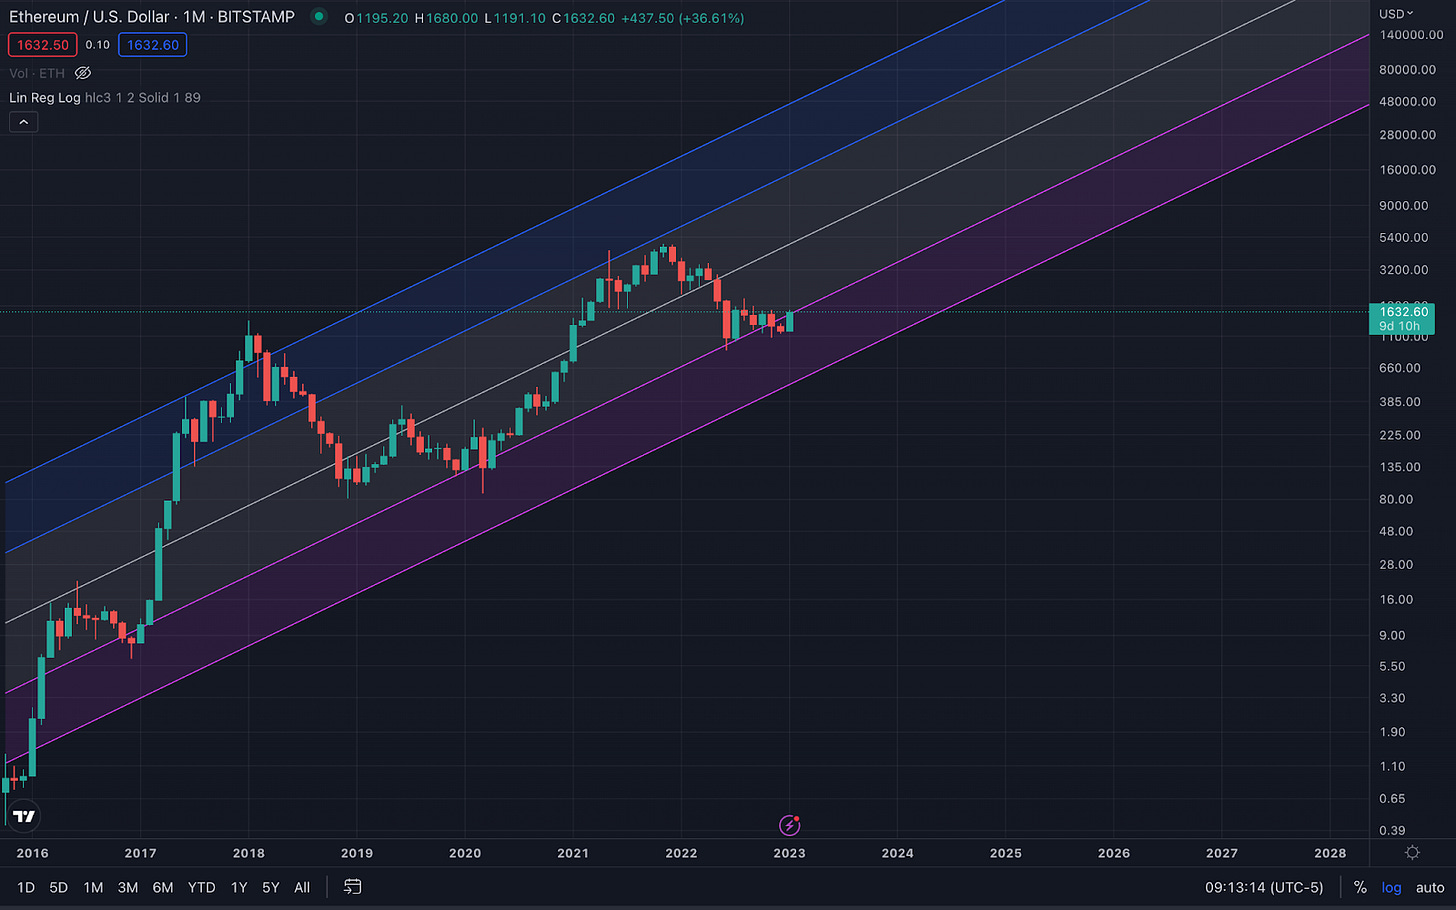
Some technologies take time before they reach network effects. Check out the chart below showing the full picture of Apple since going public in 1980.
It took around two decades before the company enjoyed exponential adoption.
To further highlight the impact of Metcalfe’s Law, ETH has grown in value significantly faster than BTC grew in value in their first 8 years respectively. Why is that?
It’s likely because Ethereum has more types of “participants” in its network, creating stronger and more numerous connections.
Bitcoin on one hand has its holders and users, as well as its miners and then its core developers as participants in the network.
Ethereum also has its holders and users, its validators (who used to be miners), and its core developers. However, because Ethereum has smart contracts it also has developers of other applications being built on top of Ethereum, plus those applications’ holders and users.
Ethereum has the potential for network effects on top of network effects when you take into account every application or use case that could generate adoption on top of it.
This is akin to the internet having the compounding impact of Amazon, Google, Apple, and others building on top of it. 🚀
You might be saying “Ok Kyle, so you’re bullish on ETH, what’s your point?”
The second lesson of this report is to position yourself to be investing, building, and networking in a space that is part of a secular trend.
This will give you the long-term conviction to keep building and learning through the ups and downs. As an entrepreneur and investor do NOT underestimate the importance of having conviction in what you are doing.
Cyclical ups and downs will happen in technology (explanation of why coming below), but don’t let those buck you off the trend!
The good news is that if you are in web3 then you are part of one of the fastest-growing secular trends in history.
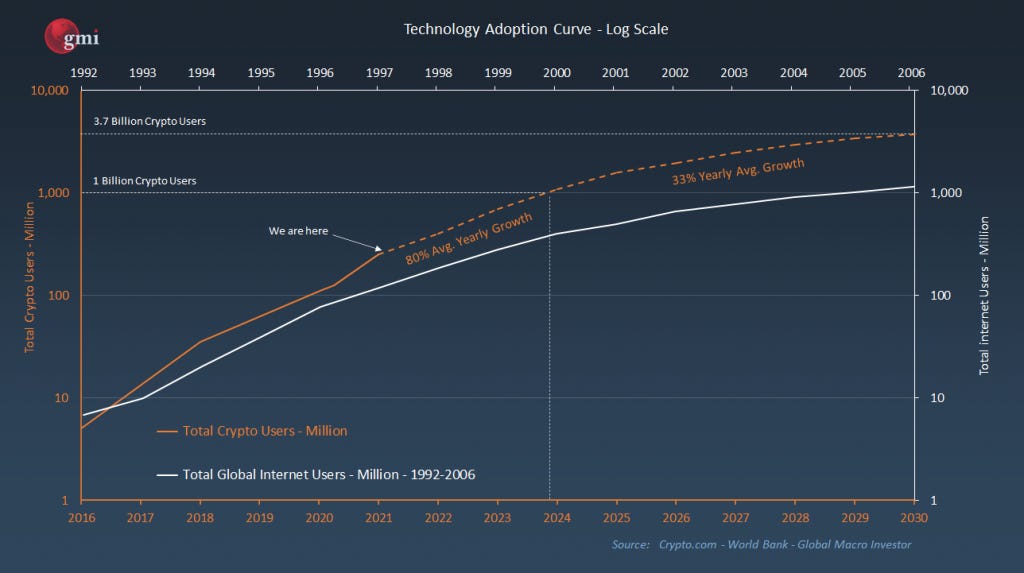
Below is a chart comparing the technological adoption of the internet vs crypto. Interestingly, crypto is growing much faster than the internet itself did and is no doubt currently benefiting from Metcalfe’s Law.
Ok, let's move on to the cyclical trends
Cyclical Trends of Technology Prices
If you’ve spent any time going down the crypto rabbit hole, you’ve probably come across the idea of “crypto cycles”. The booms of 2013-14, 2016-17, and 2020-21, and the busts during the years in between.
The most common explanation for these cycles in the crypto world is that they are attributed to the Bitcoin Halving Cycle, whereby every 4 years Bitcoin cuts its inflation rate in half thus igniting a bull run.
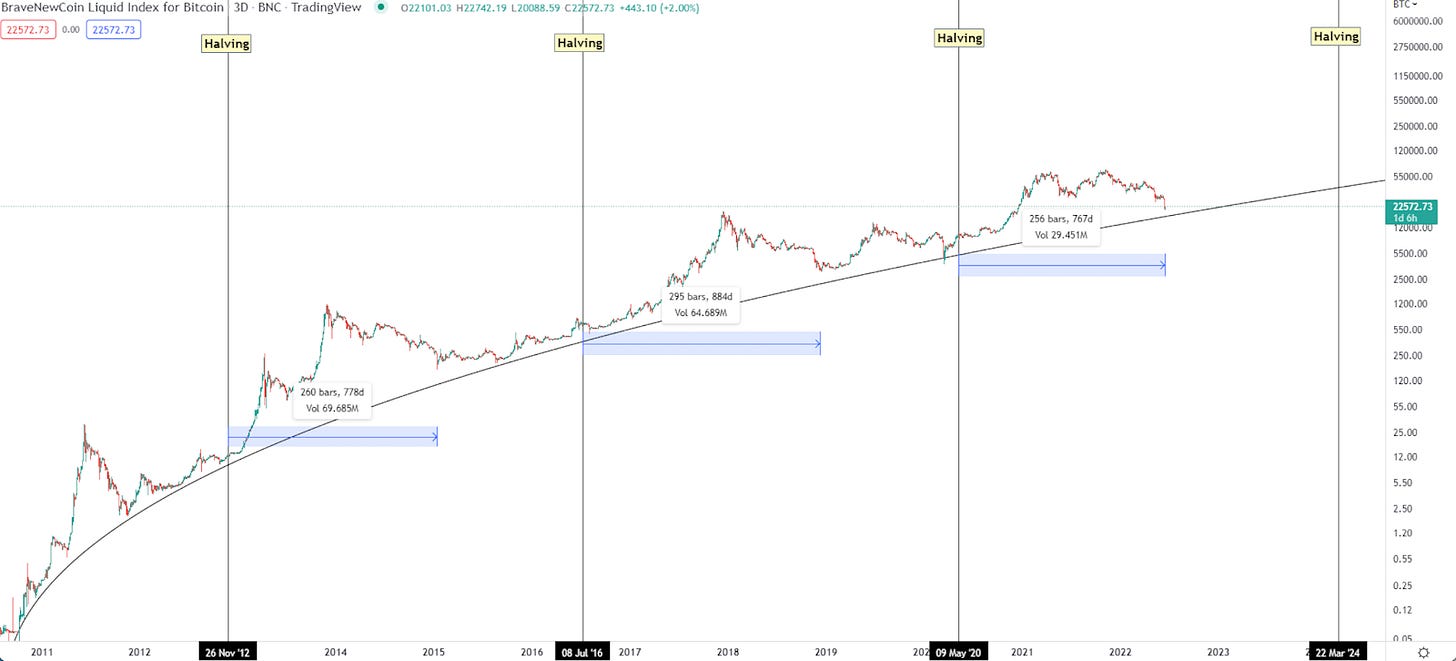
While I’m sure the halving cycles have some part to do with “number go up”, I believe it’s more of a coincidence than anything.
Why? Because technology stocks outside of crypto performed similarly over the same time period and they have nothing to do with Bitcoin’s inflation rate.
So what’s causing these crypto cycles? 💭
The same thing that always causes pricing cycles in technology—the business cycle. I’ve talked about the business cycle a few times on the podcast, but it is essentially a controlled cycle from central banks and the federal reserve which control the cost of capital (interest rates) and the supply of money.
They use these 2 levers to stimulate or slow down the economy when needed.
If interest rates are low and the supply of money is increasing, the economy is stimulated and we go through a growth phase (an expanding economy). Technology, especially those with network effects, see incredible growth in value during this time. 📈
When interest rates are higher and the supply of money is neutral or decreasing, the economy slows down and growth is suppressed (a contracting economy).
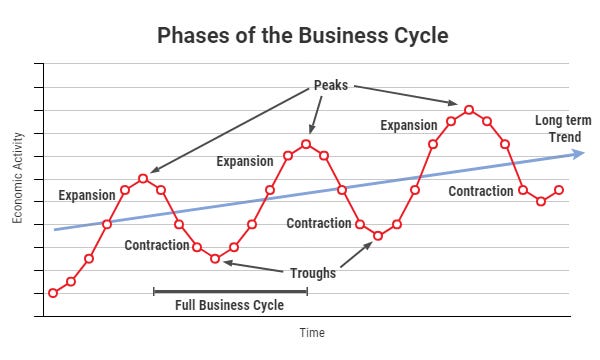
These cycles have been occurring for decades and will continue to happen so long as the monetary supply is controlled by central banks. If you track the global money supply (aka M2) you can see these cycles clearly.
In the chart below you can see the year-over-year % change in global money supply (white line) and its cycles versus the year-over-year % change in the price of the S&P 500 (blue line).
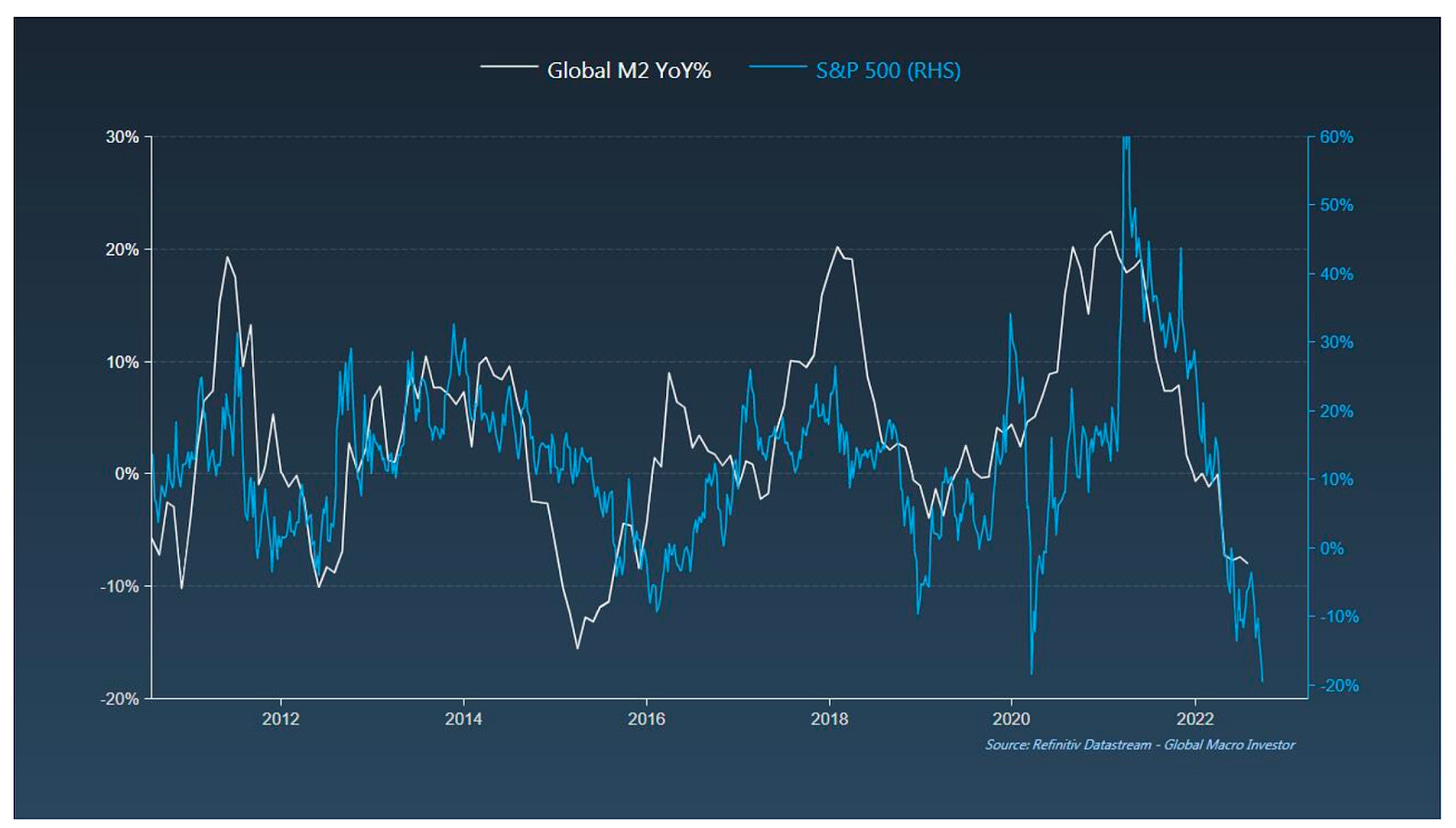
Outside of the black swan event of the Covid crash in 2020, the correlation couldn't be more clear. Now let’s take a look at what happens when we line up the global money supply with the price of Bitcoin—a technology with exponential adoption.
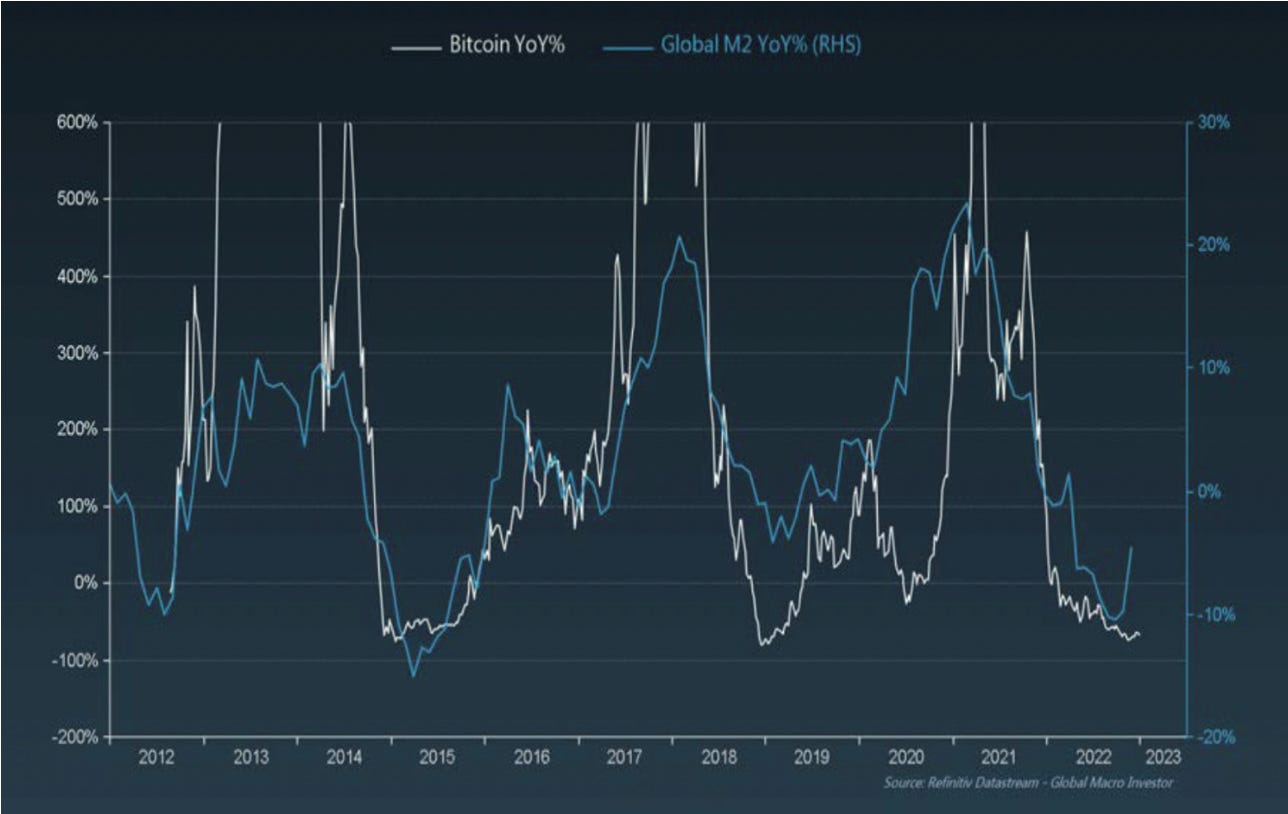
Bitcoin literally goes off the charts! As you can see from this chart Bitcoin tracks almost exactly what is happening with the global money supply, yet overshoots every time money supply increases
Raoul Pal from Real Vision gives the best explanation as to what we are seeing here when Bitcoin goes off the charts. This is the impact of Metcalfe’s Law and exponential adoption.
Technologies with exponential adoption see exponential growth, specifically when economic conditions support it.
But when economic conditions suppress growth, these technologies are like a beach ball being held underwater ready to burst into the air once the weight holding it down is removed (aka the money supply begins to grow).
Now, of course, trying to predict when the money supply is going to expand or shrink is not an easy task. 😅
So again I’m not trying to time markets here. But this brings me to lesson #3 of this report.
Crypto cycles occur as a result of the global money supply, not the bitcoin halving cycle. Do your best to understand (or follow people who understand) the macro environment, so that you can be aware of when the tides are changing in terms of monetary supply.
Use the business cycle to keep you proactive with your business, getting investment, managing your capital, or even launching products.
Understanding the business cycle will help you block out all the noise that comes with the question, “Why are markets moving?” Instead, you’ll be able to simplify your strategies based on a real phenomenon rather than an arbitrary event.
Charts Aren’t Just For The Traders!
I’m not a trader, I have 0 interest in it. I barely even invest in crypto assets outside of ETH and BTC. Of course, I FOMO’d into a few shitcoins when I first got into the space, though… but who didn’t?) 😂
But if I know so much about the space, why don’t I do it now?
I simply don’t have the time to be good at it. I’m focused on learning, networking, building businesses, and generating cash flows. These things maintain value regardless of where we are in the cyclical trend.
That said, I still take the time to understand the charts, the trends, and the macro environment because it helps me have conviction in the things I’m building and helps me strategically position my businesses and allocate my capital accordingly. 💪
Being an entrepreneur is already stressful enough as is, so I couldn’t imagine doing it in web3 if I didn’t understand why the markets move as they do.
My hope from this report is that it will give you the conviction to start the business you wanted to or help you stay the course in what you’re already doing. Hopefully, it can help you navigate the volatility of crypto and web3 with a bit more clarity and confidence.
If you like this type of content, please let me know in the comments below.
I’m well connected with various macro analysts and am thinking about having them write some macro updates inside Milk Road PRO on a monthly or so basis.
If you would be interested in that (or if not), please let me know. 🙏
Thanks, friends!