Are You Ready For A 30% Pullback?
This Will Help You Invest In The Markets
April 06, 2024
GM Milk Road PRO! 😎
Welcome to our second Milk Road PRO report, rolling into your Saturday as reliably as the ice cream truck on a hot summer day.
We're going to dive right in with a burning question that you should actively be thinking about.
Are you prepared for a 30% pullback? What about a 50% pullback? Or even a 90% pullback?
Think about what that means for a second. 💭
If you currently have $100k invested in crypto, your balance would drop to $70k, $50k or even $10k.
Are you ready for that? Because it will 100% happen.
How do we know that?
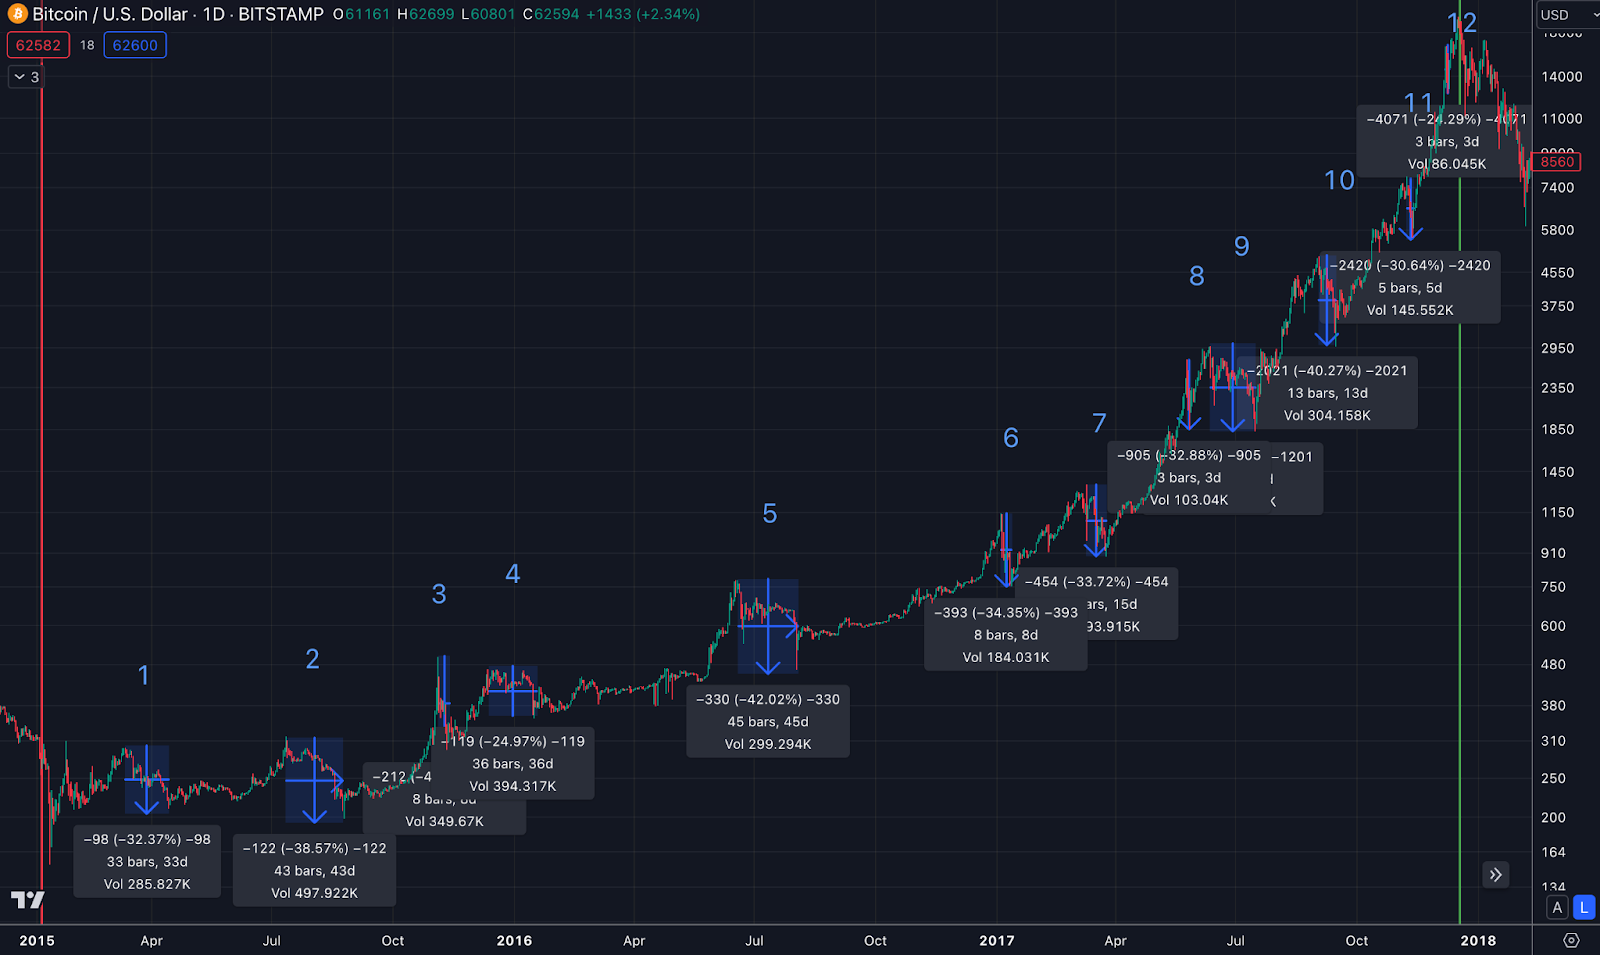
Because in the 2016-2017 bull cycle, Bitcoin experienced a 20%+ pullback a whopping 12 times.
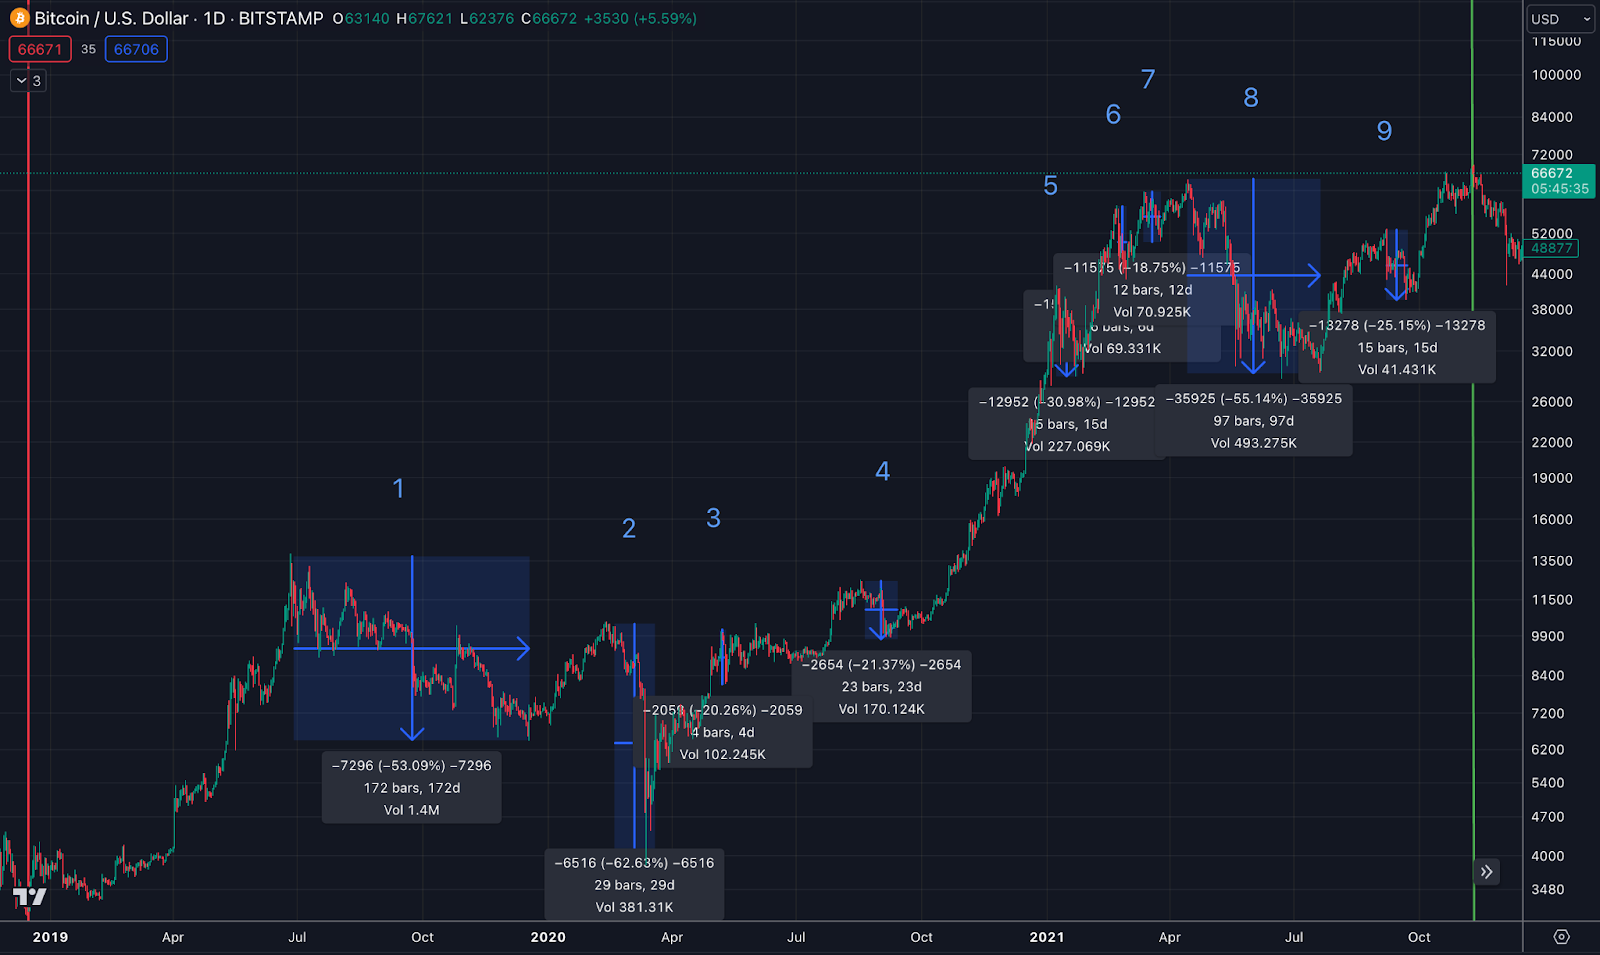
In the 2020-2021 bull market, it happened 9 times.
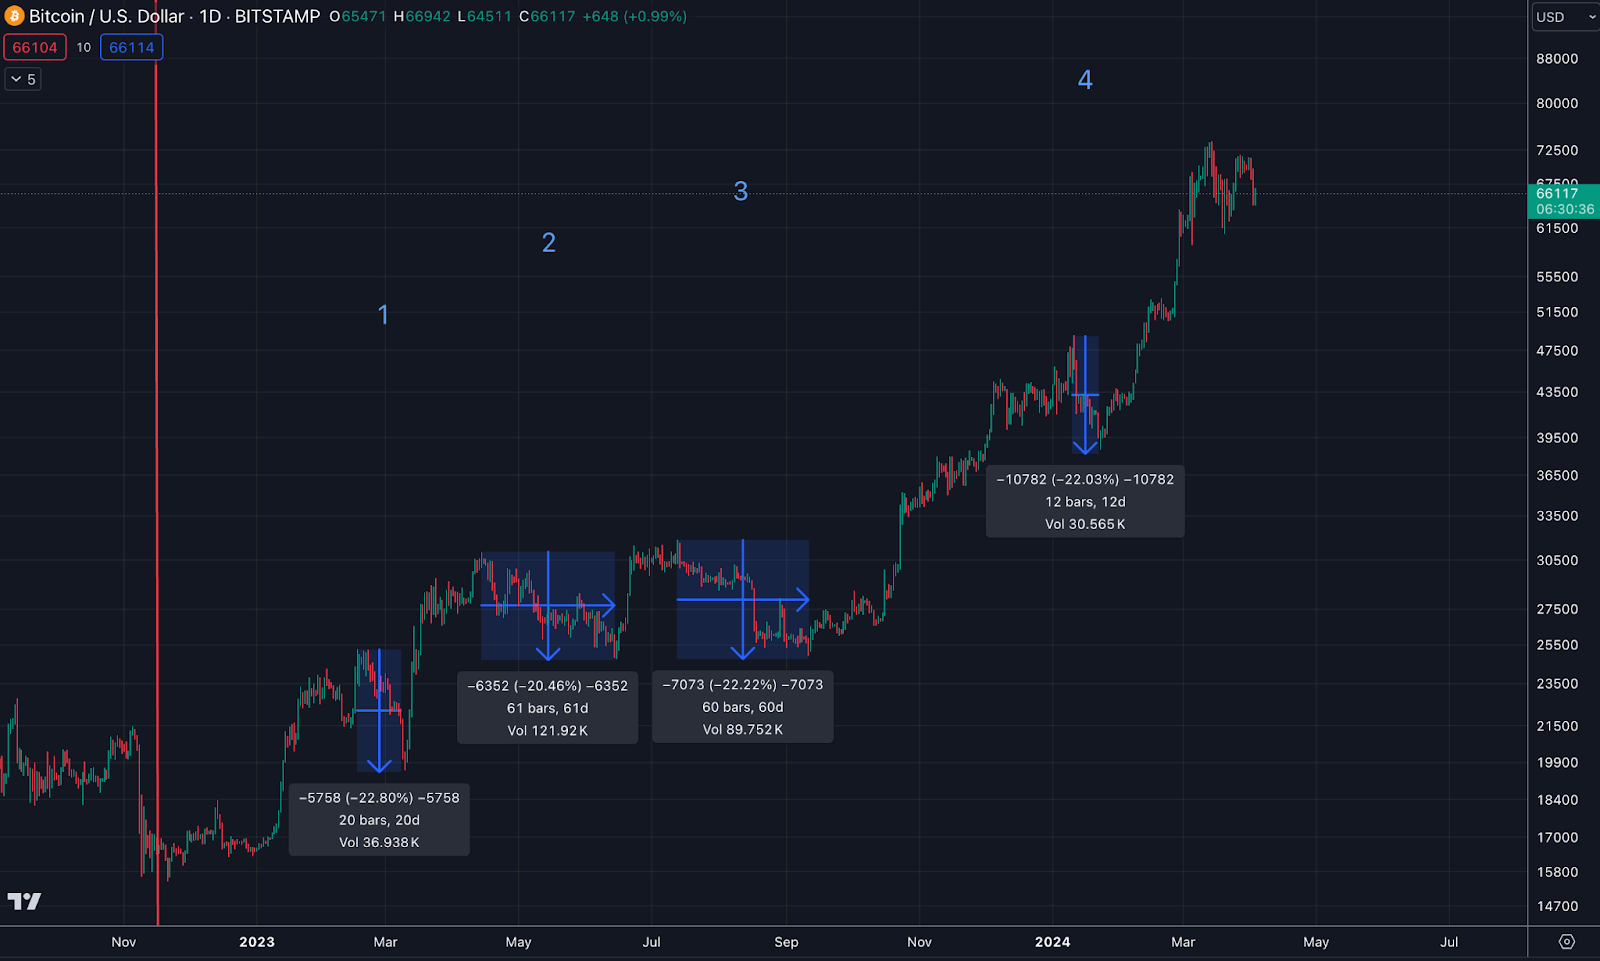
And, in case you haven’t noticed (or you just entered the crypto space), it’s already happened 4 times during the current bull market.
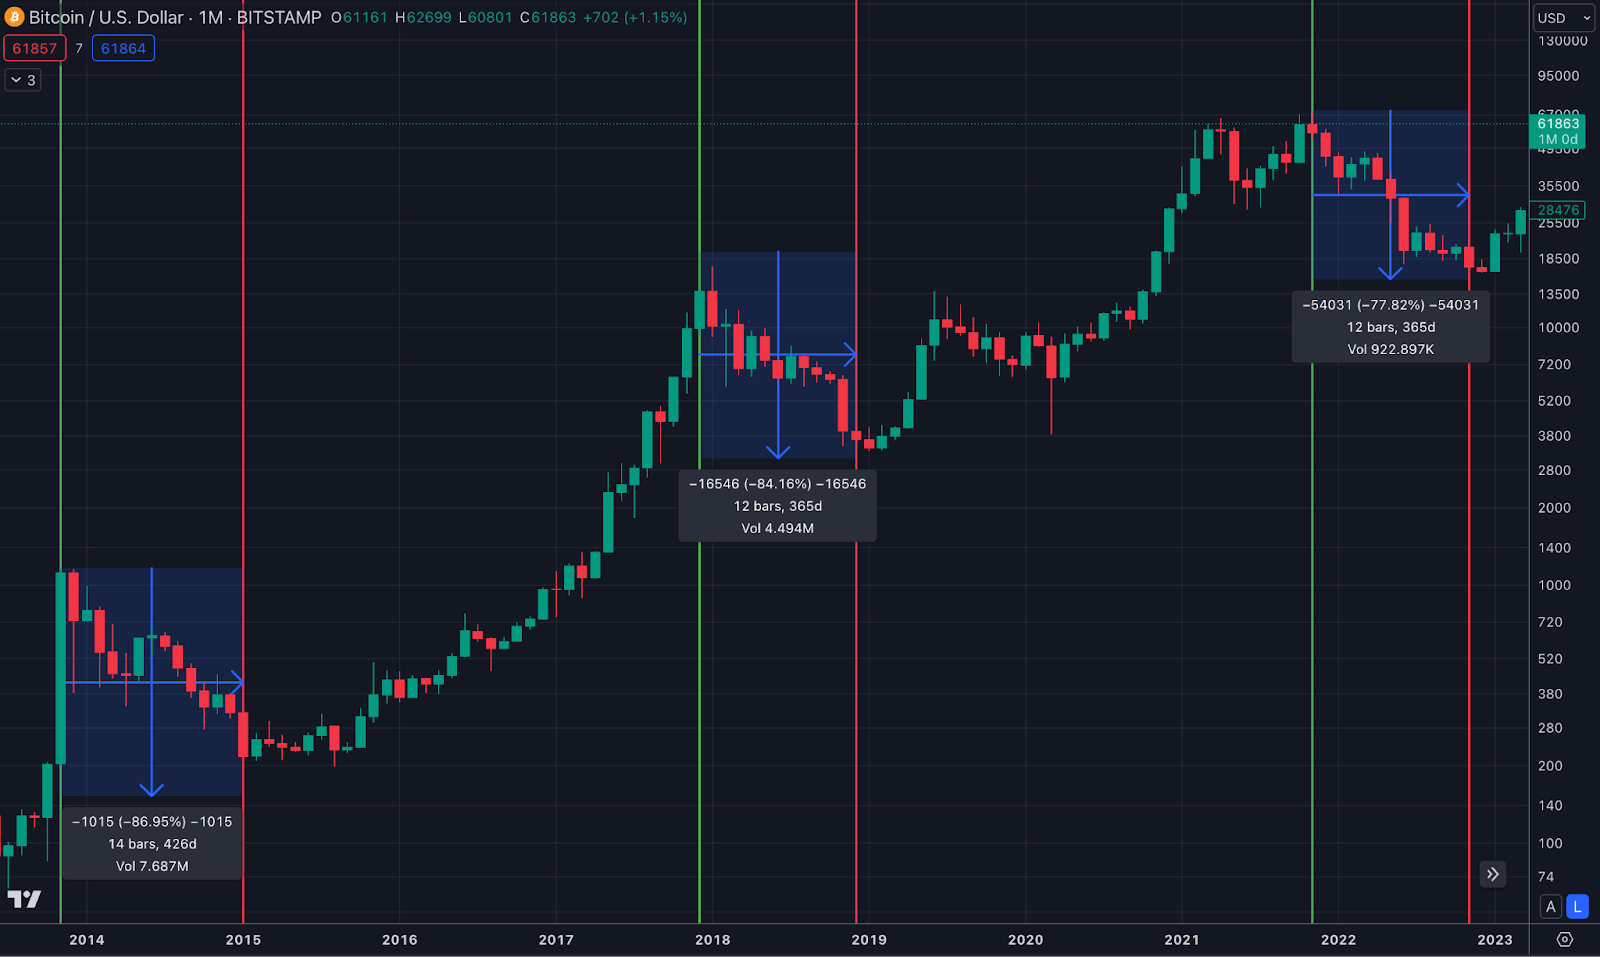
And by the way, this doesn’t even include the biggest pullbacks of them all, which occur at the end of each bull cycle. In Bitcoin we’ve seen drawdowns of 87%, 84% and 78%...
If that’s not bad enough, the numbers and charts above are only tracking Bitcoin, the most “stable” crypto we have today.
You don’t even want to know what the pullbacks are like for the smaller market cap tokens. 😬
Welcome to crypto my friends. 🫡
In today’s PRO report we’re going to face our fears and dive into these pullbacks and figure out how we can use them to our advantage. Putting in the work now will help you when the inevitable happens.
Pullbacks of this size are never easy to stomach. It’s the reason why so many retail investors and new entrants into crypto lose money in a bull market.
But if you know what to expect and what to do when they happen, you can set yourself up for massive success during crypto bull markets (...and limit your losses during the bear markets).
You can also use pullbacks to gauge where we are in the overall cycle, allowing them to actually help you make better investment decisions.
Let’s start with understanding the anatomy of the pullbacks within each cycle and then we’ll move into understanding why they happen and what you can do about it.
BREAKING DOWN PULLBACKS WITHIN CRYPTO CYCLES 📉
When studying these pullbacks, there are a few things to consider:
-
The severity of the pullback.
-
The time it takes for the pullback to complete and reach its low.
-
The time it takes for the pullback to recover back to new highs.
-
The time between pullbacks.
The anatomy of pullbacks can help you to understand where you are in the cycle. But moreso, understanding pullbacks will help you to manage your emotions and prevent you from making mistakes.
This is something we talked about in more detail in our 5 Best Tips For The Crypto Bull Market Report.
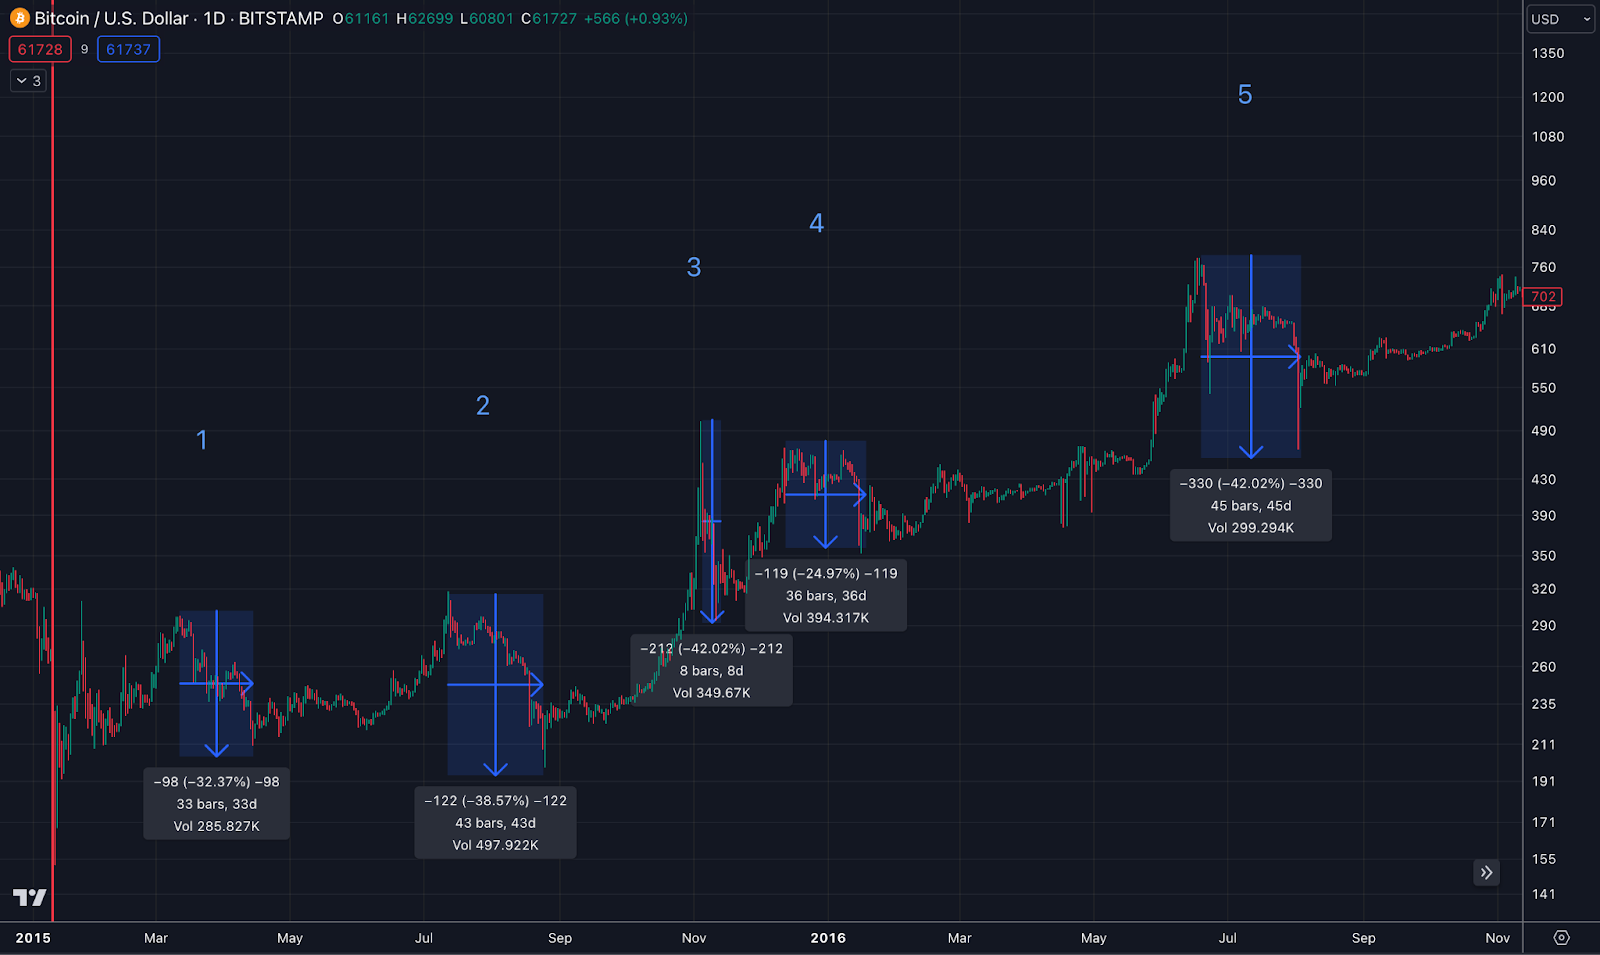
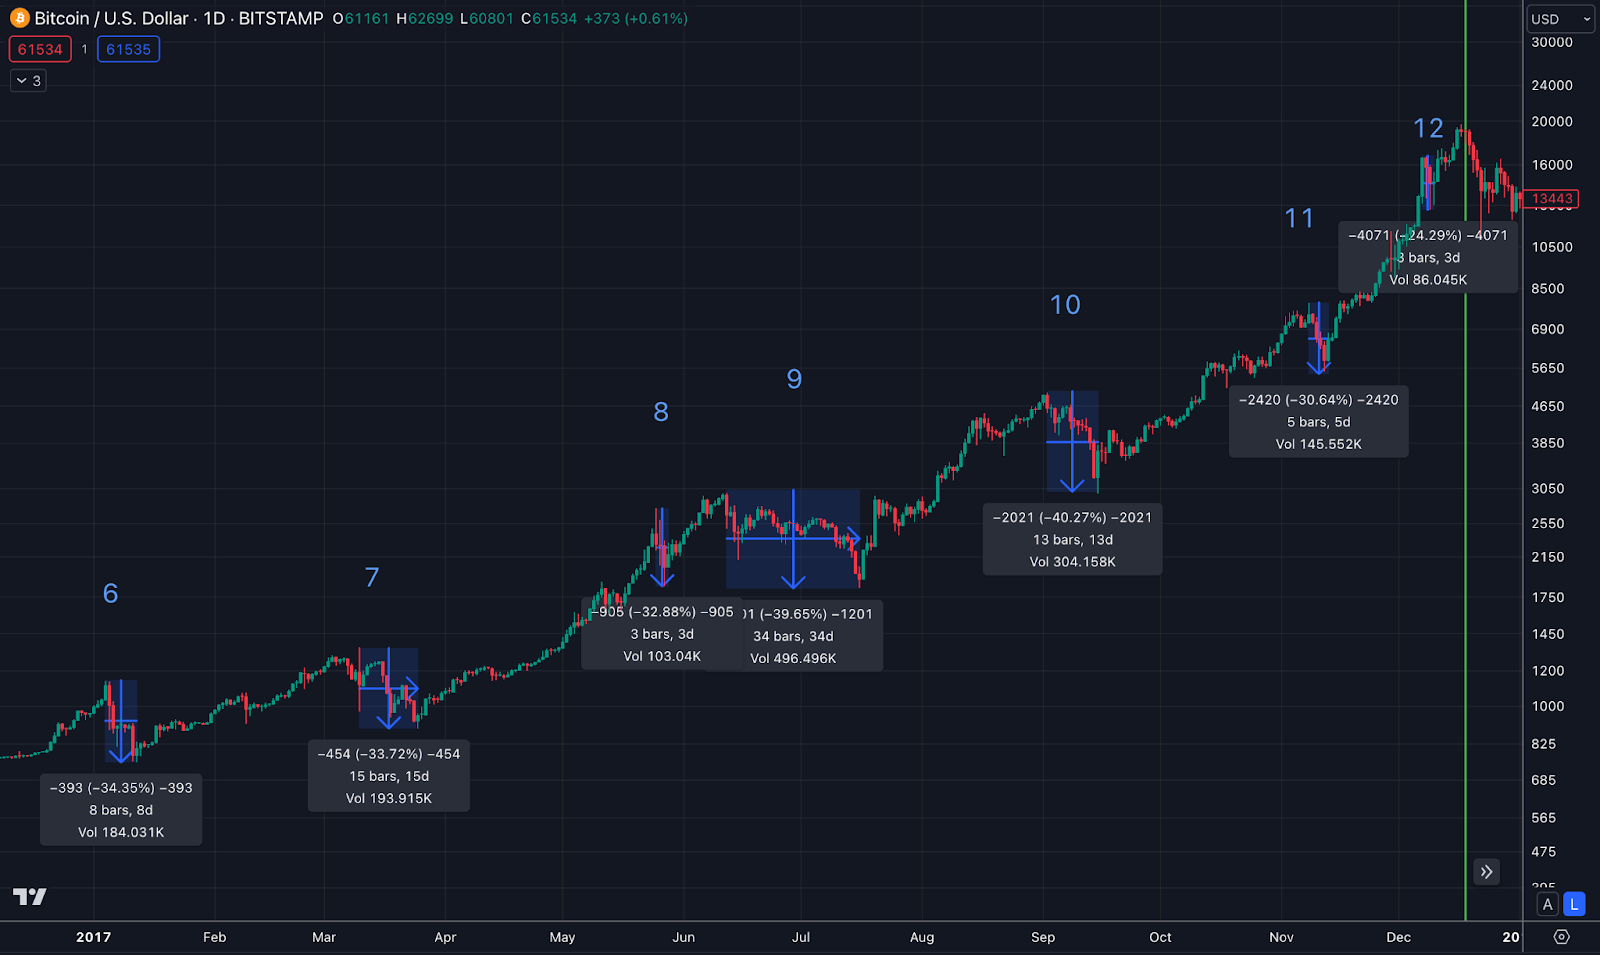
Let’s get started by examining Bitcoin in its first mainstream bull cycle from 2015 to 2017. There were so many significant pullbacks we had to zoom in and split the cycle into 2 charts.
The first chart below shows 5 pullbacks larger than 24% in a 2-year span, starting from the bottom of the cycle in January 2015, until the end of 2016.
In the final year of the bull market (2017) we saw another 7 pullbacks above 24%, before the beginning of the biggest pullback into the bear market of 85%.
To better analyze the date, we’ve created a table breaking down the severity of each pullback, the number of days to reach the low, the number of days to reach the high from the start of the pullback and the number of days between the previous pullback, from low to the start of the next pullback.
The colors attempt to showcase the “aggressiveness” of each metric – darker colors mean bigger changes or faster moves to highs and lows. Lighter colors mean smaller changes.

In this cycle, our takeaways are the following:
Firstly, the pullbacks become more frequent the further we get into the cycle. We can see that in the first 2 years, there were 5 pullbacks.
In just the last year, there were a total of 8. We can see that the time between pullbacks becomes much shorter near the top of the cycle too.
Secondly, the pullbacks themselves become much shorter. You can see that the time to the low and the time to the high are much faster as we get closer to the end of the cycle.
Thirdly, in the middle of the cycle, there seems to be a lag period where the length of pullbacks and between pullbacks are drawn out.
In this cycle, the length between pullbacks was more than 100 days for 2 pullbacks straight, the only times this occurs in the entire cycle.
Once this was complete, the aggressiveness really picked up.
Fourthly, after surpassing the previous all time high, we had almost exactly 1 year until the top of the cycle.
Let's move onto the 2019–2021 cycle and see if we can find any similarities.
The one thing to point out before we inspect this cycle is that it had some very unique events occur in the middle of it.
Early in 2020, the COVID pandemic hit, and towards the end of the cycle, there was a big scandal with FTX. They were caught using customers' money to manipulate the market with billions of dollars.
Let’s take a look anyway.
From December 2019 to the end of 2020 we saw four big drops of more than 20%.

And then, in the final year, we saw 5 more drops of over 20% before it hit the peak. After reaching the top, Bitcoin went into a downturn, dropping by 78%.

Below is a similar table looking at the aggressiveness of the pullbacks.

*There was another significant pullback before the current pullback made it completely back to all time highs.
In this cycle, our takeaways are the following:
Firstly, once again, the pullbacks became more frequent as we neared the top of the cycle. There were 4 in the first 2 years and then a total of 6 in just the final year.
Secondly, this time around the pullbacks themselves were not any faster near the end of the cycle, like we saw in the last.
In this cycle, just about every pullback quickly made it to the lows and quickly back to highs.
Though, you could argue that through the cycle the time back to all-time highs was faster later in the cycle.
Thirdly, once again, it appears we had a lag period where the length between pullbacks was drawn out more than 100 days for 2 pullbacks.
In both cycles, this was at the 2-year mark and the point in the cycle at which the frequency between pullbacks picked up significantly.
This was also the point where Bitcoin surpassed the previous cycle's all-time high.
Fourthly, once again, after surpassing the previous cycle's all-time high, we had almost exactly 1 year until the cycle top.
Moving on to the current cycle, where the low was put in November, 2022, we have had 4 pullbacks of more than 20% so far as of April 5th, 2024.

There’s not much we can take from these pullbacks yet as there are only 4, however let’s table and color them anyway.

Here are our thoughts on the numbers mentioned:
Firstly, the pullbacks in this cycle seem less severe than what we've seen in earlier cycles, particularly in the initial phases.
Secondly, Bitcoin has already hit all-time highs, much faster compared to the previous two cycles.
In this cycle, it took 482 days for Bitcoin to reach previous all-time highs from the cycle low vs. 731 days last cycle and 774 days the cycle before that.
Thirdly, this cycle has seen its first pullback that lasted over 100 days since the previous one, which was in January after the ETF was approved.
Currently, we're 75 days into a period without a 20% pullback, at the same time as we've surpassed previous all-time highs.
This could indicate we're in the lag period mentioned above before entering the final phase of the bull cycle, which might see an increase in the frequency of pullbacks.
If this pattern holds and we continue to exceed past all-time highs, historical trends suggest we're about a year away from this cycle's peak. This would point to a top around March 2025.
That said, we’ve also just experienced an 18% pullback and have yet to reach new highs from the peak, so there’s potential for us to go lower, marking a 20% pullback and invalidating the pattern above.
The other thing to keep in mind is so far this cycle’s pullbacks have been much less severe, so maybe the minimum for a “major” pullback needs to be lowered for this cycle.
Of course, none of this is a perfect science, it’s just analysis to help provide us more data points to build out our thesis.
Our key takeaway from the above analysis comparing the 3 cycles is that we are still early in this bull run.
The hype cycle part of this bull run has not yet started and whether we are still in the early stages or somewhere in the middle is unknown, but something we will continue to analyze and watch for.
Regardless, until the final phase of the bull cycle sets in, continuing to accumulate on a monthly basis looks like a good idea.
Ok, now that we understand the anatomy of the Bitcoin pullbacks throughout each cycle, let’s talk about why they occur and how we can use them to our advantage.
WHY DO PULLBACKS OCCUR? 🤷
Pullbacks can occur for a variety of reasons and most of the time we don’t actually know the reason, especially in the moment.
After the fact, there are some data points we can look at to understand its severity (i.e. liquidations, what wallet(s) sold a large amount, delayed news that comes out, etc.).
A pullback can occur based on negative news, overleveraged markets that cause a cascading effect once the price pulls back to a certain liquidation number, buyer exhaustion, market manipulation and more. Oftentimes, it's a combination of many of these.
Whales or institutions with large amounts of an asset will wait for markets to get overleveraged and then use a piece of news (whether it be real or planted) to short the market, while also selling a bunch of their own assets to start the cascade.
They then buy their assets back at the lows, when the cascade ends and take their profits from shorting the market and turn them into a long.
This was much more common in Bitcoin in its previous cycles, as it’s much harder to do now with its $1.3 trillion market cap.
That said, it's no doubt still occuring in smaller assets like $ETH, $SOL and even further down the risk curve.
No one can predict when a pullback is going to occur, however some of the best tools to predict them are:
1/ Technical analysis
Using resistance and support indicators and a variety of other TA indicators can help predict when a pullback may occur, though this is by no means 100% accurate.
2/ Analyzing the leverage in a market
Looking at leverage can help you gauge when the market is getting a bit too bullish and also to understand where the liquidation points are for large holders.
3/ Investor sentiment
Market sentiment via social cues or the fear and greed index can be helpful in understanding when a pullback may occur. Too much excitement generally means a pullback (or the top) is near.
This is why we feature the Milk Road Fear and Greed index in every free newsletter.
None of this is a perfect science and it’s impossible to predict when a pullback will occur, so don’t take these indicators as black and white.
When things look overheated, it doesn’t mean you need to sell everything, it just means you might want to take some profits or close your leverage.
Remember, these are just short-term pullbacks that almost always recover within 1-3 months, unless it’s the big pullback at the top of the cycle.
This leads us to the last section on how to use these pullbacks to your advantage.
HOW TO MANAGE PULLBACKS 💪
Pullbacks are a natural part of any bull market, especially in crypto where things are over exaggerated. The key is to know they are coming and not let them scare you or deter you from sticking to your plan.
A 30-50% pullback in a matter of days can be a punch in the face in the middle of a bull market, especially when most of your net worth is in crypto.
This is why it's so important to develop a plan before the bull market occurs (or before you allocate your capital into the markets if you're late to the party).
You should already have a buying and selling strategy that you follow, regardless of a pullback. Here we have a guide on How To Build Your Portfolio For The Bull Market and a When To Sell Plan to help you navigate this current cycle.
Below are the Milk Man’s tips for navigating these pullbacks during this bull market:
First off, generally, nothing should change with a significant pullback unless it’s part of your strategy to buy the dips.
In some instances, if you’re dollar cost averaging and you have the capital readily available, you may want to move up the date to buy if a nice pullback comes your way before you're meant to make your monthly purchase.
Our team does this all the time with their portfolios. Once, our social intern asked for his salary in advance so he could buy the dip. Degens…
If you’re buying altcoins during pullbacks, look for those who perform the strongest in a pullback (i.e. they pullback the least), not the ones who got “rekt” the most.
This is not the market telling you that that token is on more of a discount and you should buy it, it’s the market telling you that there are many weak holders of that token and it’s not an investment you want to be holding for long!
Of course there are exceptions to this. If a pullback occurs at the same time as “bad news” or something comes out about a fundamentally strong project, then it might be a perfect buying opportunity.
Do your due diligence, don’t just blindly make investments!
Secondly, study the pullbacks as we did above to help guide you on where we are at in the cycle. For many, your strategy might be to take some profits off the table (or all of it) near the top of the cycle.
Of course, you’re never going to time the top perfectly, but based on our research above, when the pullbacks start to become more frequent, it may be time to take some profits, regardless of how bullish the market sentiment is. We’ll continue to update you on this as the cycle plays out.
Lastly, if you study the pullbacks and you expect them, you can better control your emotions when they happen.
The famous Mike Tyson quote of “everyone has a plan until they get punched in the face” applies to pullbacks.
These are the moments when people get scared and sell or they rotate into higher risk assets to win some back and end up getting rekt. Your main goal this cycle should be to NOT f*ck this up.
Buy solid assets early and do your best to hold them throughout the cycle, taking profits when your strategy tells you to.
Especially in the later stage of a cycle, when the frequency of pullbacks picks up, doing less is more.
We can’t stress this enough. Yet, this is always the point when retail investors end up doing WAY more than they should have.
Study these cycles and study these pullbacks and use them to your advantage.
Good luck out there! ✌️
Action Step For NEW PRO Members
Join the Private PRO Community now!
This is your all-access hub for engaging directly with the Milk Road PRO research crew and fellow PRO members, diving into live AMA sessions, digital events, and daily robust discussions on market trends, fundamentals, and industry insights.
🚨 Important: Upon joining the Discord, you’ll be asked to fill out a form. Please, please pay attention to 2 things:
-
Enter the exact email address you used to sign up to PRO with.
-
Enter your exact Discord username. To find your Discord username, click on your profile picture in Discord. Your username is the smaller text name under your profile picture.
Do this with bomb-defusing precision – a single typo might lock you out! 😬