3 ways to determine a token's fair price
Learn how to spot undervalued investment opportunities
July 27, 2024

GM! Welcome to Milk Road PRO – your weekly jolt of crypto insights that's hotter than slick bacon on a Las Vegas solar panel. 🥓
Today, we're going to be a practical Paul. You shop every day, but sometimes you skip that fancy latte because it’s just too pricey, right?
Now, when it comes to buying tokens, how can you tell if they're overpriced? Nobody wants to splurge on something that's too expensive.🧠
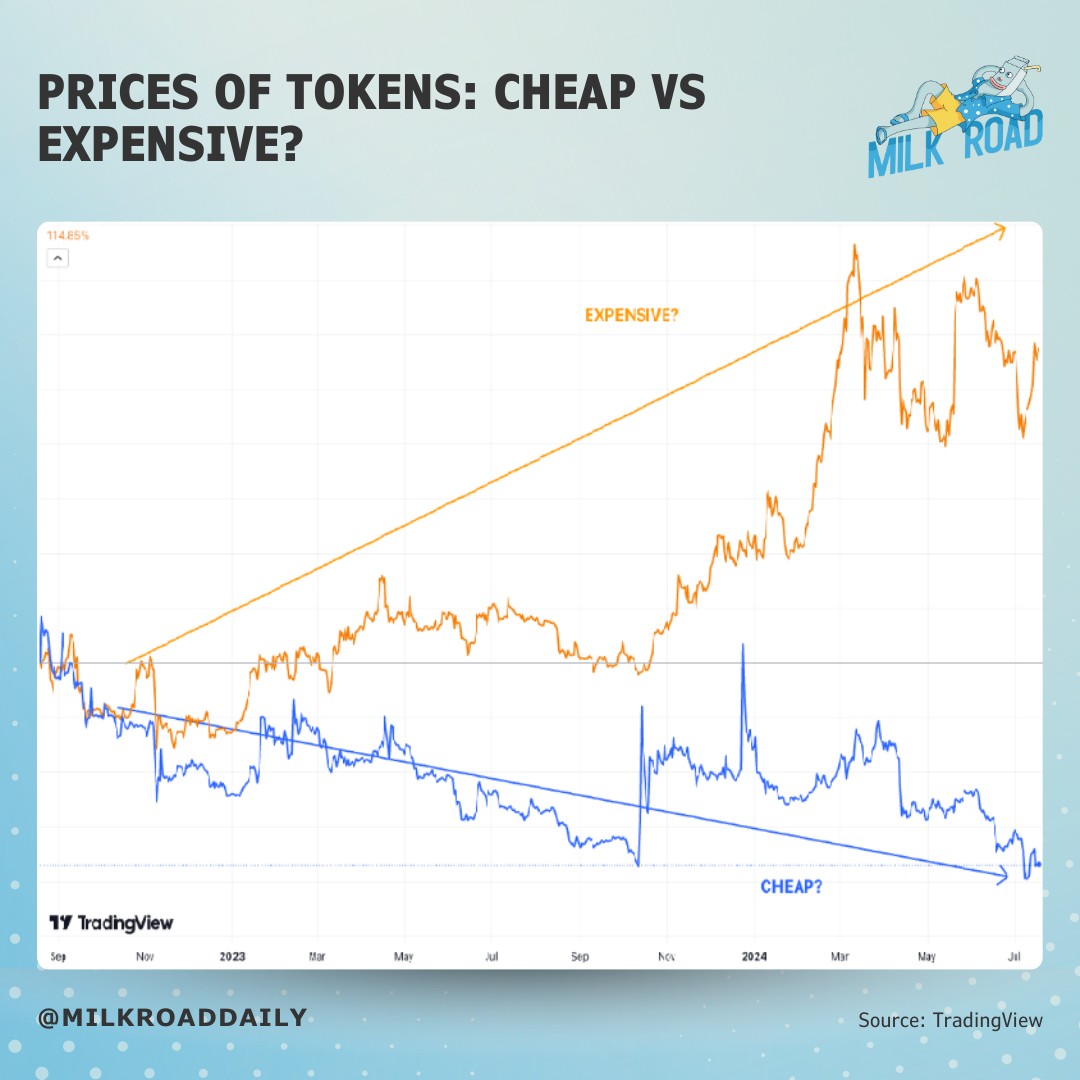
Check out the chart below. It shows the price performance of 2 different tokens. Do you think the orange one is overpriced and the blue one is a steal?
[
Source: Tradingvew
Alright, so eyeballing charts like this isn't the way to go. But many people rely on charts alone to gauge a token's value. So what is the right move?
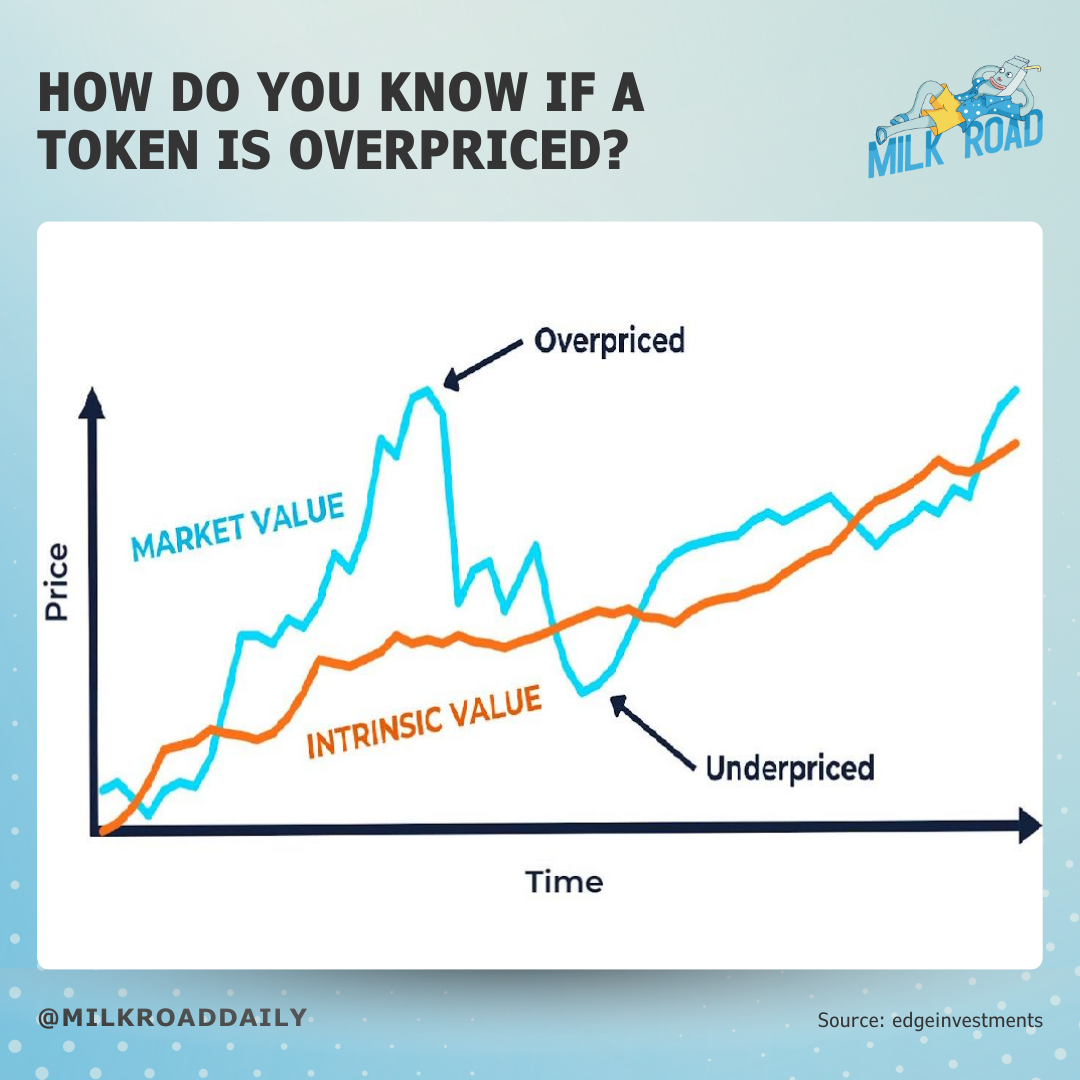
People should compare the current price to some “fair” price (intrinsic value). See the chart below. 👇
[
Source: Edgeinvestments
Now, how do you figure out intrinsic value? Our mission is to find this out today. We’ll break down three methods to nail down the “fair” price:
-
Relative comparison
-
Over/undervalued using the annualized revenue to market cap ratio
-
Potential valuation based on projected revenue to market cap ratio
Sound complicated? Don’t sweat it. We’ll guide you step-by-step with real-world examples:
-
Is $SOL overpriced compared to $ETH?
-
What is the fair price of $LDO?
Plus, we’ve got some killer tips at the end to help you value any token like a PRO!
🚨 This report is inspired by one of the modules in our Crypto Investing Masterclass.
By reading this report, you’ll have a deep understanding of how to value crypto assets and how to pick winning investments.
However, if you’re hungry for more foundational insights such as:
-
How crypto cycles work
-
How the flow of liquidity works
-
How to allocate your portfolio to minimize risk and MAXIMIZE the upside
-
And more…
Then we recommend you take the Crypto Investing Masterclass today, so you can build a long-standing crypto portfolio in the future.
PLUS: You now have a 50% PRO-only discount – which expires in ~48h – take action now.
P.S. You can now purchase the Masterclass with crypto. 🥳
Aight, back to the report. Let’s go!! ⤵️
(There’s a competition for you 🫵 at the end so stick around. 👀)
RELATIVE COMPARISON ⚖️
Time to roll up those sleeves and get practical. This approach is all about gathering similar projects and comparing their valuations to figure out the fair value.
Let’s kick things off with an example and then we’ll break down the pros and cons of this method.
In our example, we'll assess both onchain numbers and qualitative metrics.
This gives us a more complete picture and helps make more accurate comparisons, giving us greater confidence in the results.
Here’s the kicker: Instead of comparing a token to a bunch of others (which can get messy), we focus on one single token. This keeps things clean and avoids unnecessary noise.
Therefore, we choose to compare our token with the market leader or a major player in the sector.
This strategy helps us reduce the risk of inaccuracies from mispriced tokens, ensuring a more reliable assessment.
However this is our approach. We prefer **quality over quantity.**🧐
Feel free to tweak this approach to fit your needs. You might want to zero in on specific metrics like TVL, or even compare your token to a handful of others.
Catch the drift? The more effort you put into this analysis, the more confidence you can have in your results.
Alright, with all that being said, let's finally show you an example:
Is $SOL overpriced or underpriced? Let’s milk this approach step by step:
1/ Pick Your Contender: What other token do you want to compare Solana with?
We want to find a market leader or some major competitor. We chose Ethereum.
❗$SOL is currently trading at 18% of Ethereum’s market cap.
Okay, we have our base. Now, let's determine whether $SOL being traded at 18% of Ethereum's market cap is high or low. This will help us figure out the fair price for $SOL.
2/ Pick your metrics: What quantitative metrics do we want to compare?
We want to use the most relevant metrics which are commonly used for analyzing blockchains. Therefore we are going to use:
-
Active users
-
Fees
-
DEX Volumes
-
Stablecoin Volumes
-
TVL
-
Active developers
❗Based on Q2 performance, Solana now has:
-
50% of Ethereum’s Users
-
27% of Ethereum’s Fees
-
36% of Ethereum’s DEX Volumes
-
190% of Ethereum’s Stablecoin Volumes
-
7% of Ethereum’s TVL
-
And 11% of Ethereum’s Developers
Great, we have some numbers. However, there might be other factors we should consider.
3/ Factor in the extra stuff: What are some other qualitative areas we want to look at?
We need to identify some other relevant metrics to compare, as they might significantly impact our valuation. These include:
-
Value accrual
-
User Experience
-
Upcoming catalysts
❗Value accrual: Solana doesn’t have Layer 2 projects gobbling up user fees and market share. The $SOL token captures value like $ETH by burning fees and growing its network effect.
❗UX: Solana is simply better. Fees are cheap, there's no bridging, transactions are instant.
❗Upcoming catalysts: Ethereum has the ETF buzz that could flood $ETH with new money and spike the price. Solana’s got Firedancer, set to light up the mainnet later this year, enhancing performance, reliability, and scalability by handling more transactions simultaneously.
Now that we’ve chewed through all the juicy quantitative and qualitative bits, let’s figure out the fair price of $SOL. 🤔
4/ Over or Undervalued: What is the fair price of $SOL?
Based on our deep dive, we reckon Solana is undervalued, currently trading at just 20% of Ethereum’s market cap – which makes it 5x cheaper. 🤠

[
Source: TradingView
Is Ethereum 5x 'better' than Solana? We don’t think so.
Given that Solana:
-
Has 50% of Ethereum's users
-
Generates 27% of its fees
-
Handles 36% of its volume
-
Processes twice the stablecoin volume
-
Offers better value accrual, UX, and overall blockchain performance
Additionally, the upcoming Firedancer client is a powerful catalyst for Solana.
Set to launch later this year, it’s poised to supercharge Solana’s performance, reliability, and scalability by nixing the single client dependency.
So, we believe Solana should be valued at least at 30% of Ethereum.
This is our base case, but there's potential for Solana to exceed this value.
Anyway, here is how we calculate the fair price:
-
Ethereum's Market Cap: $400B
-
Solana's Estimated Market Cap: 30% of Ethereum's, which is $120B
-
Circulating $SOL Supply: 464M
-
Fair Price Calculation: $120B ÷ 464M ≈ $258
It suggests the fair price for $SOL compared to $ETH would be approximately $258.
❗With $SOL currently trading at $182, this indicates $SOL is underpriced vs $ETH.
Now that we've shared an example of this valuation approach, let's highlight some pros and cons:
✅ Can uncover very promising investment opportunities
✅ Can be straightforward by comparing only selected quantitative metrics
❌ Investors need to know which metrics to look at
❌ Requires a deep understanding of both projects (tokens)
❌ Analyzing qualitative factors can be challenging and demanding
❌ There's a risk of mispriced valuation affecting the entire sector (ie. Ethereum is overvalued)
❌ Relies on assumptions that may not hold true
👉 Overall, this approach can be straightforward, but for a more thorough assessment, additional time and expertise are required.
We will share some tips at the end as well. Let's move on to another way to value tokens.
MARKET CAP TO REVENUE RATIO 🚀
This approach is simpler and involves finding the annualized revenue and the market cap of the project you are evaluating.
Let's illustrate this with a practical example, so you can apply the guide yourself.

[
Source: TokenTerminal
-
Pop over to TokenTerminal and insert the token you are interested in ($LDO).
-
Peak at the table for the 'P/S ratio circulating / 30d%' value.
-
Slide to the right-hand side, select the same metric to view its historical chart.
Boom, you're done. Great, but what do you do with the value you get from this?
Here are two things you can do:
-
Compare historical levels for this token to see its usual trading range
-
Check if it is below your benchmark to gauge its current value
Let's elaborate on each option, starting with the first: Compare historical levels of P/S for $LDO token.

[
Source: TokenTerminal
Currently, $LDO trades at 14.7x, close to its yearly low.
The average trading ratio is around 23x (red rectangle). This suggests that $LDO's current price is 1.57 times lower than the fair price (calculated by dividing the avg P/S ratio by the current P/S ratio).
This suggests a fair price for $LDO would be approximately $2.77.
❗With $LDO currently trading at $1.76, this indicates $LDO is cheap.
Simple enough, right? But here’s the snag: some tokens trade at sky-high levels for a long time, making this method a bit less effective at times.
Let us show you an example using $MPL, the token of Maple Finance, a lending protocol.

[
Source: TokenTerminal
The P/S ratio for $MPL is currently at 188.7x, which is also close to its yearly lows.
But the average P/S ratio is around 250x, suggesting that the fair price is almost 2x higher than the current price.
Do you think these high levels are reasonable? We don't. 🤷
So, this brings us to the second approach: Comparing the current P/S levels to our benchmark ratio.
Crypto has not yet matured and its markets are not efficient, making accurate price discovery more challenging. However, we can look at traditional markets to determine reasonable levels.
To do this, we borrow the famous Price-to-Earnings (P/E) ratio from the traditional finance world and apply NVDA's current P/E of 71 here.
That's the ratio we used in our PRO report on the DeFi sector, and we want to maintain consistency.
Here is P/E for Nvidia over time:

[
Source: ycharts
So just a quick reminder why we chose to use Nvidia's ($NVDA) P/E ratio as a benchmark:
-
Market perception: Nvidia's P/E ratio reflects how markets value revolutionary technologies like AI. Similarly, crypto has the potential to disrupt many industries.
-
Revenue growth: Nvidia's revenue grew 4x YoY, and we anticipate revenue of some crypto projects to grow even faster.
-
Sustained valuation: Nvidia has maintained these P/E levels for several years, indicating that such valuations can be sustained long-term, which we expect for crypto as well.
➡️ Nvidia trading at higher levels is a trend we see for crypto revenue generating apps too.
You can come up with your own final number, but we chose 75 and stick to it. Now, we simply compare the current P/S ratio from Token Terminal to 75.
So we can loosely say:
-
P/S ratio < 75: The token is undervalued and has upside potential.
-
P/S ratio > 75: The token is overvalued and has minimal upside potential.
Easy peasy, right? 🍋 Now, you might be tempted to hit Token Terminal and snap up all tokens with a P/S ratio below 75. Hold your horses—this method has its ups and downs.
✅ Super easy and fast
✅ Similar to the popular approach among stocks (using P/E ratio)
❌ Uses revenue, which can be artificially boosted by incentives
❌ No guarantees that this revenue is sustainable (competition)
❌ Uses market cap, which changes not only by price movements but also by unlocks
❌ Suitable for revenue generating projects only, discounting network effects.
👉 This method is a good starting filter, but you need to dig deeper. Look into incentives, unlocks, revenue sustainability, and competition for a thorough analysis.
As savvy investors, we should always have an eye on the future.
Here's the last way to value tokens, which can complement the above approach since it also uses revenue.
MARKET CAP TO PROJECTED REVENUE RATIO 🔮
The twist here is focusing on projected instead of current revenue. So, how do you project revenue?
Let's use another practical example, sticking with Lido ($LDO).
1/ Understand how the revenue is generated.
In Lido's case, people deposit $ETH (TVL) to receive staking yield. Lido charges a 10% protocol fee from the staking yield.
❗Therefore, the higher the TVL and staking yield, the higher the revenue for the protocol.
2/ Determine if Lido's TVL and Ethereum staking yield will rise or fall from here.
Starting with TVL.
Lido TVL = # of $ETH * price of $ETH
Lido is the market leader with a 29% market share and has 9.7M $ETH in TVL. In the last month alone, 177K $ETH were added to Lido, so we expect the number of $ETH to continue growing.

[
Source: Dune
Regarding the second variable, the price of $ETH, we anticipate that it can hit $12k (almost 4x from the current price). See our price predictions PRO report here to learn more. 📚
But let's play it safe and say it only triples to $10k.
P.S. Feel free to insert whatever price you feel reasonable here for your own calculation.🤔
❗Therefore, we can expect Lido's TVL to increase at least 3x over the next 12 months.
Moving on to staking yield.
We won't go into too much detail here, but it's important to note that more blockchain activity is expected as more use cases emerge and more users start to use blockchain.
It increases the staking yield.
❗We expect the staking yield to increase to at least 4% from the current 3.44%.
So let's put everything together. Our 2 assumptions are:
-
TVL will do 3x (prices up)
-
Staking yield will be 4% (blockchain activity up)
-
Protocol fee remains unchanged
[
Source: TokenTerminal

So Lido will have $100B in TVL and the staking yield will be 4%. Therefore we believe Lido can generate an annual revenue of $402 million.
To keep it simple, we didn’t factor in more $ETH being staked with Lido—just the TVL bump from rising prices (3x).
Some might argue that $ETH prices around $10k are not sustainable, making the revenue seem unstable. However, Lido accumulates its fees in $ETH. This means Lido can sell 50% of their collected $ETH at $8k and the other 50% at $12k, averaging $10k.
Therefore, Lido doesn’t need prices to stay above $10k constantly to 'maintain' their revenue.
Looking ahead, we expect $ETH prices to soar in the long run. Think of Lido as the Michael Saylor of Ethereum—they’re hoarding $ETH.
If they don't need to sell, they could become one of the largest $ETH holders. As a $LDO holder, you will benefit from Lido's growing $ETH balance, which can significantly enhance the value of the $LDO token. 🪙
Great, so let's get back to figure out the fair price of $LDO. We need to divide the current market cap of $1.64B with our projected revenue ($402M) and illustrate the result in the chart below.

[
Source: TokenTerminal
We got a value of 4. Yes, you heard that right.
To reach the average P/S levels around 24, the market cap is projected to increase 6 times.
And to reach our benchmark P/S value of 75, **it is a 19x increase.**🤪
If that sounds like rocket science, don’t worry. We will show you a practical example using TokenTerminal.
Quick reminder: the revenue is a function of TVL and staking yield. Staking yield is not available on TT, but TVL is as well as revenue.

[
Source: TokenTerminal
Let's simplify the process:
-
Lido currently generates $107M (1) from $33.5 billion in TVL (2).
-
If we expect TVL to grow 3x (due to price increases and more $ETH staked), we can project revenue to be 107 * 3 = $321M
Next, divide the current market cap by this projected revenue. We get 5.1, which is slightly higher than our previous detailed evaluation but much quicker and easier to calculate.
Now let's calculate the fair price:
-
Applying historical P/S levels at an average of 24, the fair price of $LDO should be $7.92.
-
Using our P/S benchmark of 75, the fair price would be $26.40.
❗With $LDO currently trading at $1.76, it's clear that $LDO is undervalued.
So again, let's say what are the pros and cons of this approach:
✅ Can uncover very promising investment opportunities.
✅ Revenue projection addresses sustainability concerns.
❌ Needs to identify how the revenue is generated.
❌ Needs to identify what affects the revenue and predict future changes.
❌ Suitable for revenue generating projects only, discounting network effects.
❌ Relies on assumptions that may not hold true.
👉 We believe this is the golden approach. It blends current data with future projections, offering investors a great opportunity to discover alpha gems.
Now that we've presented three most common methods for valuing tokens, let's wrap up with some key recommendations.
CLOSING RECOMMENDATIONS 💭
We hope these practical examples help you value tokens on your own. Remember, this isn't an exact science, so feel free to adjust the approach to fit your needs. ✅
Additionally, keep in mind that it's not just about the final number at the end of your analysis. The process of researching, learning, comparing, and analyzing is equally important.
👉 The more time and effort you invest, the more confident you'll be in your results and the better you'll understand all the nuances.
That’s a key component to building a long-standing portfolio. Again, this isn’t exact science.
Your portfolio is always influenced by other factors too like liquidity cycles, macro, black swans etc…
So if you want to dive even deeper into what makes a successful crypto investor, then check out our Crypto Investing Masterclass.
You’ll learn how to master crypto cycles, outsmart and outperform 99% of investors, invest in the winning assets and build a successful crypto portfolio.
Start the Masterclass here w/ a 50% PRO-only discount (expires tomorrow).
Here are some final tips before we wrap up.
1/ Use relative comparisons for L1s or L2s
There is no consensus on how to value blockchains yet. Revenue is not the only factor to consider, as blockchains also capture monetary premium, benefit from network effects, and more.
2/ Use market cap to (projected) revenue for everything else
Non-blockchain projects are more similar to traditional companies or startups. Their valuations are driven by similar metrics, like revenue.
3/ Use common metrics
There are plenty of available metrics out there. You don't need to create unique metrics or approaches. Stick with the commonly used ones. (TVL, Users, Volume…)
4/ Stay unbiased
When analyzing projects, avoid overestimating to see favorable results. The more biased you are, the further you'll be from accurate numbers.
5/ Refer to commonly accepted numbers
Research widely accepted figures and opinions. Making realistic predictions based on broadly agreed numbers ensures your valuations are grounded and credible.
6/ Be open to feedback and criticism
Share and discuss your findings with others. This provides valuable feedback and helps improve your valuations.
And before we let you go, there is one more thing.
🔊 We're excited to announce a competition for the best valuation analysis!
Analyze any token and share your insights on Discord to compete for a 60-minute private session with a Milk Road PRO team member.
Here are the details:
Competition Rules:
- Eligible Projects: Must have a market cap > $100M.
Prize:
- A private 60-minute session with a Milk Road PRO team member.
How to Apply:
-
Each member can submit only one analysis (updates allowed until the deadline).
-
Share your analysis in Discord in the designated #🏆︱competition channel.
-
Keep it concise – up to 2000 characters.
-
Highlight all key points.
Deadline:
- August 11, 2024 (Sunday)
Selection Criteria:
-
Community Feedback: Use emojis on Discord to rate analyses from 1️⃣ to 5️⃣. (5️⃣ is the best)
-
Milk Road PRO Team Feedback
Remember, the main goal of this competition is to help everyone learn and gather valuable feedback. Good luck!
And that's all for today! We hope these frameworks help you view and analyze tokens from a real investor's perspective, boosting your investing returns.🚀
Take care! ✌️
ACTION STEPS FOR PRO MEMBERS 🥛
Join the private PRO community now!
This is your all-access hub for engaging directly with the Milk Road PRO research crew and fellow PRO members, diving into live AMA sessions, digital events, and daily robust discussions on market trends, fundamentals, and industry insights.
🚨 Important: Upon joining the Discord, you’ll be asked to fill out a form. Please, please pay attention to 2 things:
-
Enter the exact email address you used to sign up to PRO with.
-
Enter your exact Discord username. To find your Discord username, click on your profile picture in Discord. Your username is the smaller text name under your profile picture.
Do this with bomb-defusing precision—a single typo might lock you out! 😬