Are we entering the next phase of the bull market?
Last chance to buy “cheap” crypto!
July 20, 2024

GM! Welcome to Milk Road PRO – your weekly dose of top-tier crypto insights that will leave you feeling like an A-List celebrity at the crypto grammys. 🏆
Something unusual is happening in the markets. 👀
Stocks are skyrocketing (orange), while crypto is plummeting (blue). Typically, crypto tends to correlate with stocks, so what's going on? 🤔

[
Source: TradingView
Whenever the correlation between crypto and stocks drops below -0.8 (light blue bottom indicator), crypto tends to surge soon after.
Check out the red dotted lines marking past occurrences of this trend. 👆
Here's the kicker: we're currently at a correlation of -0.84. Does this mean we’re ready for the next big move? 👀
The gap between rising stocks and falling crypto is clear. 🪟
The chart above suggests that now might be the perfect time for crypto to gain momentum. But we can never make decisions based on just one data point or chart.
Instead, let's dive deeper into this theory.
Here are the four key areas we monitor to confirm our thesis:
✅ Macro trends
✅ Crypto fundamentals
✅ Market sentiment
✅ Technical analysis
Spotting the perfect moment isn't easy, but we have high confidence that it's right now. Why?
Because we've just reached the inflection point—the moment when markets shift from bearish to bullish.
The macro environment signals a green light for investors to go risk-on, while crypto fundamentals are stronger than ever.
Combine that with market sentiment at its lowest in the past 12 months and prices finding strong technical support levels from which they have bounced back and appear to be in an uptrend.
It looks like we can finally check all four boxes. This gives us the confidence that we've finally reached the inflection point. 🤑
Let's dive into the four areas mentioned above. By the end of this report, you will:
-
Clearly understand why we believe we are at the inflection point
-
Know our strategies on how to take advantage of it
We are excited to share this one with you. So let's get right into it. ⤵️
MACRO TRENDS 🌐
Let's start with macro trends, as they set the stage for the markets. We've already shared the chart showing the gap between stocks and crypto.
There are two possible scenarios for closing the gap:
-
Stocks will follow crypto and start to fall.
-
Crypto will follow stocks and start to grow.
Crypto is likely too small and irrelevant to influence stock market trends significantly. Therefore, the latter option—crypto following stocks and starting to grow—is more viable.
We believe now is the time for the crypto trend to not only close that gap but also accelerate much higher.
But why are we confident that stocks will continue to rise? We need to consider two key questions:
-
Where are we in the market cycle?
-
Is new liquidity entering the market?
Let's examine the first question: Where are we in the market cycle?
The chart below shows the percentage of countries in each market cycle (season) globally.
"Summer" represents the best phase for investors. During this period of strong economic growth and prosperity, stocks and other investment instruments tend to perform exceptionally well.

[
Source: Real Vision
Currently, 87.5% of countries are in the "Summer" phase. This means almost 9 out of 10 nations are poised for growth and prosperity.
And remember, rising stocks are typically a byproduct of flourishing economies. 🌐
The message is clear: Sitting on cash may not be wise. And allocating money now could be smart because we are at a point in the market cycle where growth is expected…
But nothing grows out of thin air, right? Even flowers need some summer sun.
Similarly, the market needs fresh liquidity to thrive and push prices higher. Think of liquidity as the fuel that drives the market. So, how do we get this new liquidity?
It's simple: by lowering rates and printing more money. Brrrrrrrr. 💸
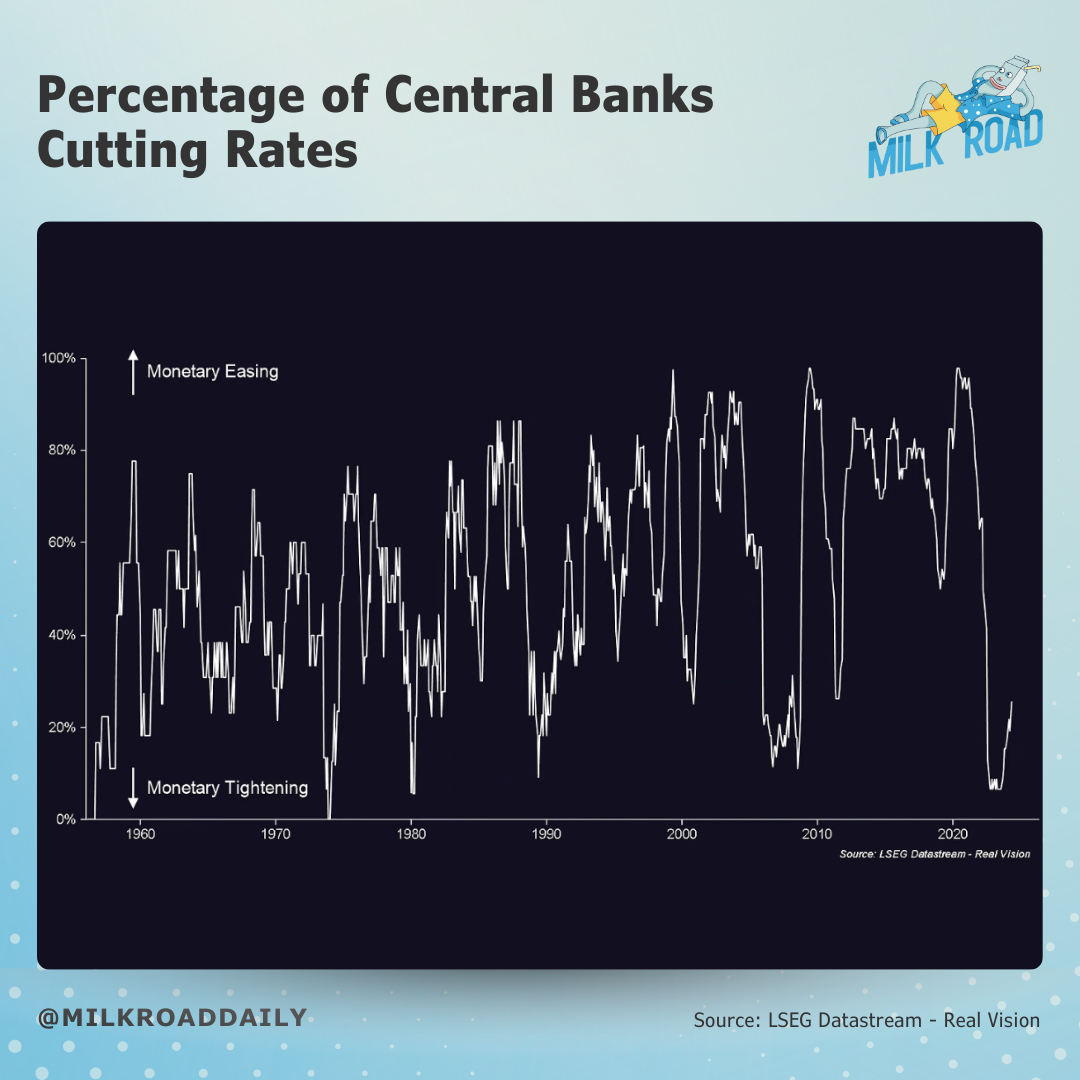
The market generally expects the US to have 2 or 3 cuts this year. Plus, over 25% of countries have already started cutting the rates and 27 of 34 central banks expected to enter easing by year end.
[
Source: Real Vision
The trend on the chart above is quite clear. More and more central banks start monetary easing by lowering the rates.
FED Chair Powell also stated that the U.S. economy is no longer overheated, emphasizing that the case for interest rate cuts is becoming stronger. 🚀
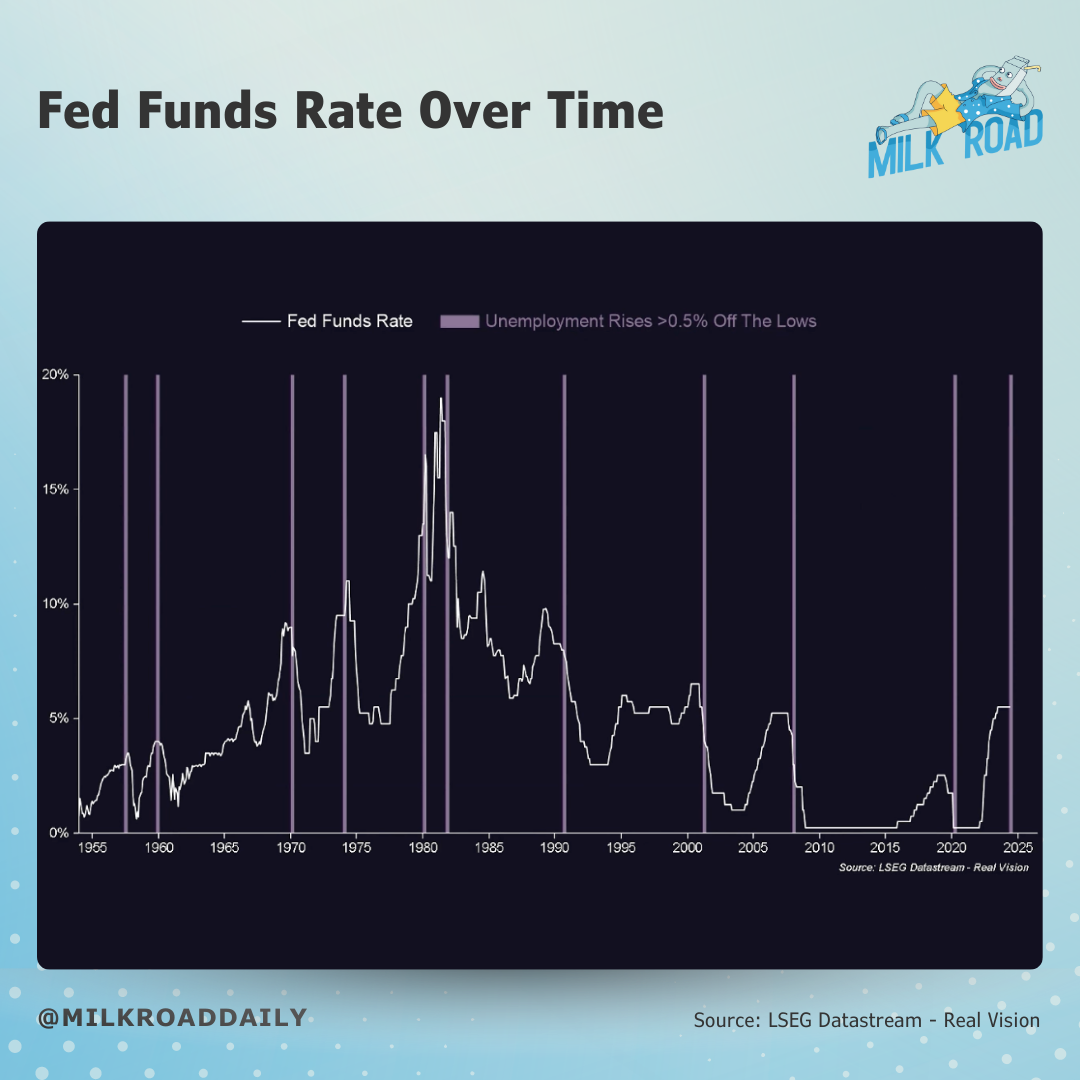
Additionally, here is a chart showing that when unemployment rises by more than 0.5% from its lows, the FED tends to react.
[
Source: Real Vision
Currently, unemployment has risen by more than 0.5%. Historically, the FED has responded to such increases with rate cuts. ✂️
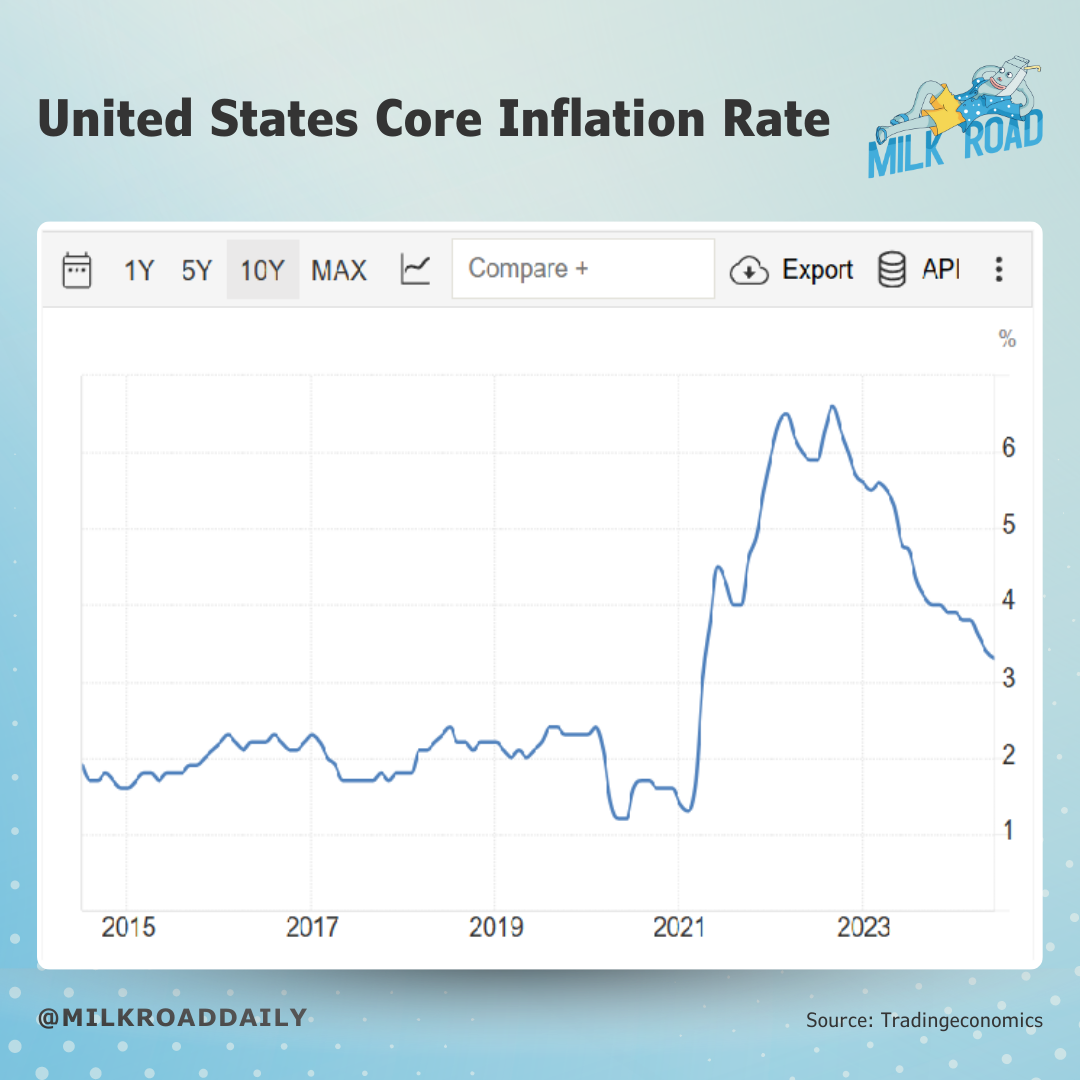
Of course, inflation has been the major concern preventing the FED from cutting rates. However, if you look at the chart of the US Core inflation rate, it’s clear we’re heading back towards the norm.
[
Source: TradingEconomics
The combination of lowering inflation and increasing unemployment makes rate cuts inevitable, which is great news for investors as it brings new liquidity into the markets.
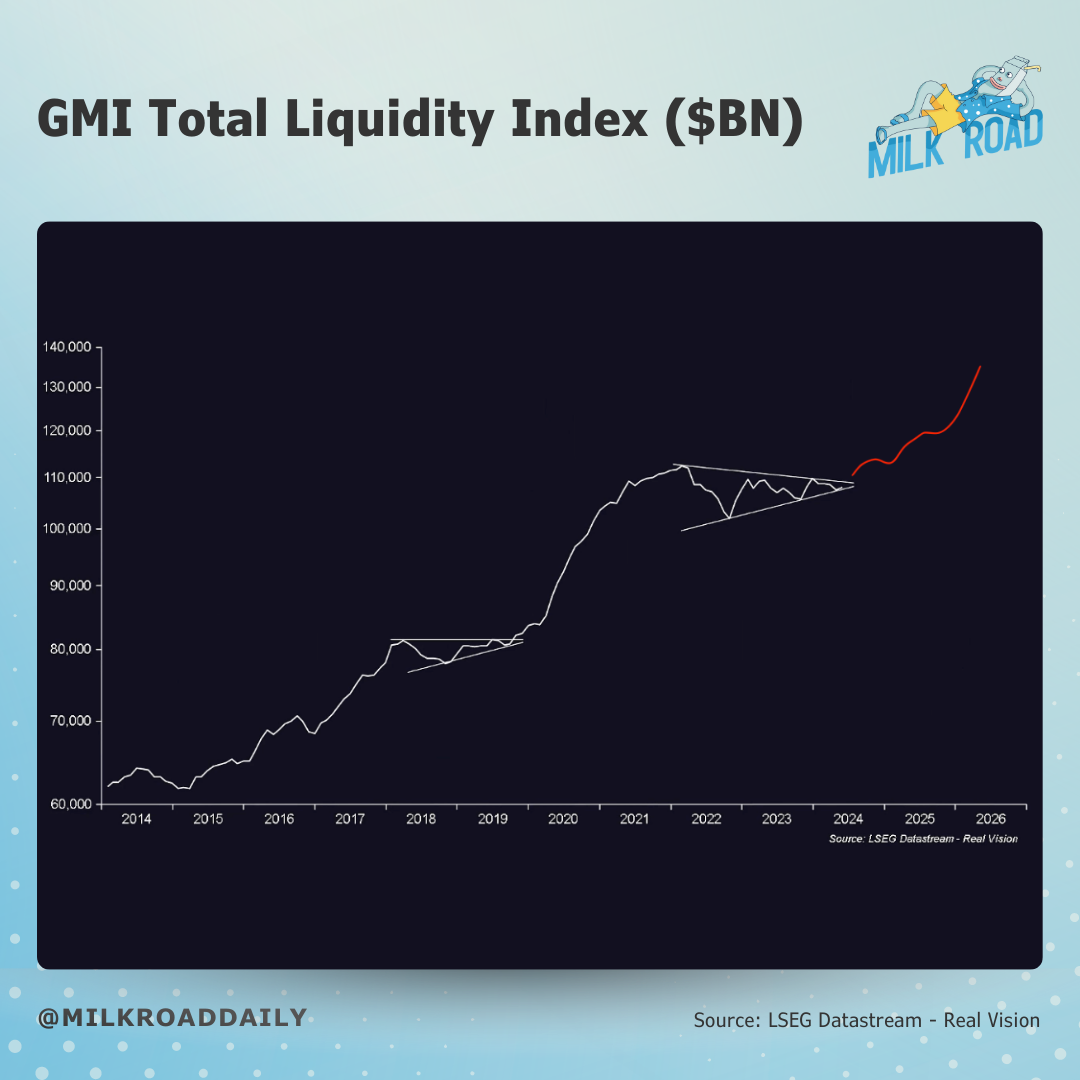
Here is the chart of global liquidity. We’ve added on some beautiful lines to show you where it’s heading next. 😉
[
Source: Real Vision
Consolidation triangles from 2018-2019 and 2022-2023 indicate periods of market uncertainty about the next move. These patterns usually hint at a big change coming soon.
Everything points to the next move being upward, just as we highlighted on the chart.
Ok, great. So macro and stocks look very positive. But what does this mean for crypto?
CRYPTO FUNDAMENTALS 🚀
If good times for investors are expected, they'll likely explore all available investment opportunities, weighing the pros and cons.
We don't claim that crypto is perfect, but it:
-
Has become a legitimate asset class (no, it is not going to disappear)
-
Is now available through spot ETFs, making it accessible to everyone
-
Gained support from some politicians and regulators, leading to clearer regulations and legislation
-
Provided excessive returns compared to other asset classes (but also volatility)
Because of these reasons we expect interest in crypto.
And for better demonstration of our last point, we use Bitcoin as the top representative of crypto to compare its returns (ROI) with other assets, which investors may consider.

[
Source: CaseBitcoin
Looking at this table, you can see the potential returns from investing in each asset. It's a pretty strong reason to be interested in Bitcoin, don't you think?
But there's more. We can compare the current cycle to previous cycles to better navigate and see the full potential.

The current cycle (green line) indicates we are in the middle of the 'painful upside' phase, but the best times are just ahead of us.
Look at the performance of Cycle 1 and Cycle 2 from the mid-yellow zone - up, up, up, up, up, up, up, up, up! 🆙
Investors love these price patterns that repeat every cycle, and so do we. Plus four-year cycles also match well with the:
-
Presidential election year
-
Bitcoin halving (see chart below)

[
Source: Real Vision
It appears we are just about to enter the 'Banana Zone', where prices tend to follow a banana-shaped pattern (red curve). 🍌
But it’s not just about prices. It’s also about the real-world use cases of crypto. While investors may appreciate the current setup, they also want to see solid fundamentals supporting their investments.
The one way to measure that is by looking at the number of active crypto addresses.

[
Source: Matthew Sigel/X
In June alone, over 100 million blockchain addresses made at least one transaction.
While addresses don’t directly translate to individual users, this highlights the growing demand for blockchain technology.
Outside of ChatGPT, no other technology has seen such growth rates in recent years.
The demand for blockchain is driven by its wide range of practical applications, similar to the internet in the 90s. 💪
Even though it's challenging to show exactly how blockchain has improved and what has been built over the years, we can use an index from a16z (one of the biggest technology VC funds in the world) to illustrate this progress.
This index tracks many important metrics like active developers, smart contracts deployed, academic publications, job search interest and more.
Think of it as an index which measures “what blockchains offer to people now”.

[
Source: a16zcrypto
Prices hit an all-time high in 2021, but there weren't many use cases back then.
At that time, the supply side index was at 150. Despite the bear market in 2022 and 2023, the index didn't decline and has now surged to 700.
The key takeaway is that the supply side, or the reasons for people to start using crypto, is much more substantial now than it was before.
It's like comparing a small grocery store to Walmart—there are now far more products and opportunities available. 🛒
Ok, so let's recap:
✅ Macro conditions are favorable for investors.
✅ Crypto presents a compelling asset class with strong fundamentals (more users, more use cases…).
But why do we think that we are at the inflection point right now?
Because we can also check two remaining boxes:
✅ Sentiment - Fear, uncertainty, and doubt (FUD) are at the extreme lows.
✅ Technical Analysis - Prices have established strong support levels.
So, right now we can cross all 4 boxes -> we are at the inflection point. Keep reading, as we’ll reveal what this means for investors at the end of the report.
Now, let's explain why we can check the Sentiment and Technical Analysis boxes, starting with Sentiment.
MARKET SENTIMENT 🌊
Sentiment reflects the market's mood. A common indicator to gauge market sentiment is the Fear & Greed Index.
So, let's take a look at this index. 🔎

[
Source: Alternative
We hit as low as 25 last week, which was the lowest point in the last 12 months.
This indicates the market is rather bearish and filled with fear, despite the Fear and Greed Index having bounced back above 70 today.
When people are scared and uncertain, it usually creates the best buying opportunities. 😜
Everything shows bullish signals, but people are extremely bearish right now due to some short-term news or events, such as the German government selling (that’s now over) and Mt. Gox refunds.
We know these factors might impact the price in the short term, but from a long-term perspective, nothing has fundamentally changed. This is exactly what we want to see.
So, sentiment box: ✅
Moving on to technical analysis.
TECHNICAL ANALYSIS 📈
Let's look at the charts to identify some levels where prices might find support.
As you probably know, the Milk Road Portfolio doesn't hold any $BTC – we prefer $ETH and $SOL.
So, we'll examine these two charts only, starting with Ethereum.

[
Source: TradingView
$ETH is currently trading at $3,408. Was it a coincidence that it bounced back from the $2,860 support level? We don't think so, as this level represents strong support that has been tested several times in the past.
Additionally, the price has recently crossed above the 200-day moving average, signaling an upward trend.
We believe this is a strong bullish setup from a technical analysis perspective.
Let's move on to Solana.

[
Source: TradingView
It may seem like the same chart, but it's not. Similarly, $SOL found strong support at $125. The market bounced back, and it's currently trading at $157.
Additionally, the price is above the 200-day moving average.
This is another strong bullish setup.
Great, so it looks like all the pieces of the puzzle are finally coming together. Let's now see what you can do with that information.
INVESTORS STRATEGY 🎮
Assuming we've reached that inflection point, what does it mean for investors? We need to distinguish between two types of investors:
-
Next Cycle Investors: Plan to sell in the next 12-18 months
-
Long-Term Investors: Plan to continue buying (DCA) over the next 5+ years
1/ Next Cycle Investors
The inflection point is primarily crucial for Next Cycle Investors. Their game plan is simple:
-
✅ Accumulate
-
▶️ Hold
-
⏹️ Sell
❗The key takeaway is that the accumulation phase is likely over.
If you planned to invest funds in the coming months, fundamentals lead to the idea that funds should already be fully allocated by now.
If not, one may want to do so as soon as possible, as markets are poised for a major surge. 🌊
❗We are entering the 'Hold' phase.
During the hold phase, investors maintain their positions, waiting for growth. This period often requires patience, as the market may fluctuate significantly. The focus is on staying invested and not reacting to short-term volatility.
It's tough to sit on your hands and do nothing, so don't mess this up!
Oooh and don't worry, we'll update you when we're about to enter the final phase: 'Sell.'
2/ Long-Term Investors
And as for Long-Term Investors, you may expect to see more green numbers in your portfolio.😂
A nice approach could be to continue dollar-cost averaging (DCA) on the regular and stick with your long-term strategy.
This is a valid approach, especially if you're investing in major assets. But nothing really changes for you.
At Milk Road, we have no stablecoins left to allocate. We plan to sell part of our portfolio at some point (next cycle investors), but we always keep a portion invested (long-term investors).
You can view our portfolio here. Be sure to join our Discord to stay updated on all trade alerts and portfolio changes.
And that's it for today. We hope you enjoyed today's edition and remember: Don't fuck this up! If you have a strong portfolio, do nothing—you'll be just fine.🤗
Good luck out there.
Take care!
ACTION STEPS FOR PRO MEMBERS 🥛
Join the private PRO community now!
This is your all-access hub for engaging directly with the Milk Road PRO research crew and fellow PRO members, diving into live AMA sessions, digital events, and daily robust discussions on market trends, fundamentals, and industry insights.
🚨 Important: Upon joining the Discord, you’ll be asked to fill out a form. Please, please pay attention to 2 things:
-
Enter the exact email address you used to sign up to PRO with.
-
Enter your exact Discord username. To find your Discord username, click on your profile picture in Discord. Your username is the smaller text name under your profile picture.
Do this with bomb-defusing precision—a single typo might lock you out! 😬